Costs are derived functions. They are derived from the technological relationships implied by the production function.
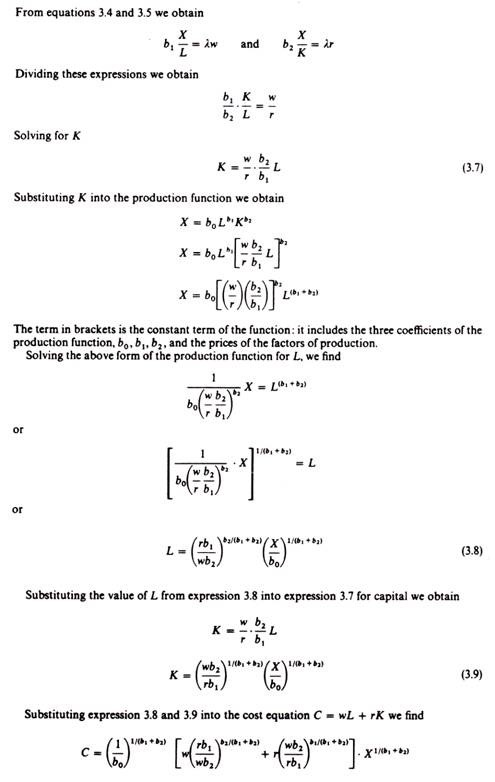
We will first show how to derive graphically the cost curves from the production function. Subsequently we will derive mathematically the total-cost function from a Cobb-Douglas production function.
A. Graphical Derivation of Cost Curves from the Production Function:
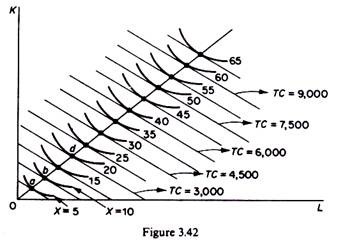
The total cost curve is determined by the locus of points of tangency of successive iso-cost lines with higher isoquants.
Assumptions for our example:
ADVERTISEMENTS:
(a) Given production function (that is, constant technology) with constant returns to scale;
(b) Given prices of factors
w = 20p per man hour
r = 20p per machine hour
ADVERTISEMENTS:
The following methods of production are part of the available technology of the firm. They refer to the quantities of L and K required for the production of one ton of output which is the ‘unit’ level.
The cost of each method for the production of one ‘unit’ of output (given the above factor prices) is as follows:
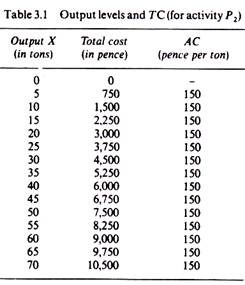
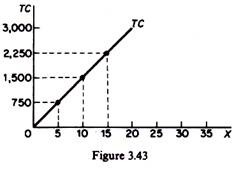
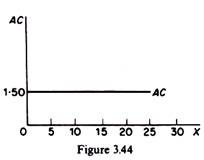
Clearly the least-cost method of production, given our assumptions, is the second method (P2). This method will be chosen by the rational entrepreneur for all levels of output (given the assumption of constant returns to scale). Table 3.1 includes some levels of output and their respective total costs (for the chosen least-cost method of production, P2). The product expansion path is shown in figure 3.42. It is formed from the points of tangency of the iso-costs and the isoquants. The TC curve may be drawn from the information (on output and costs) provided by the points of tangency. For example,
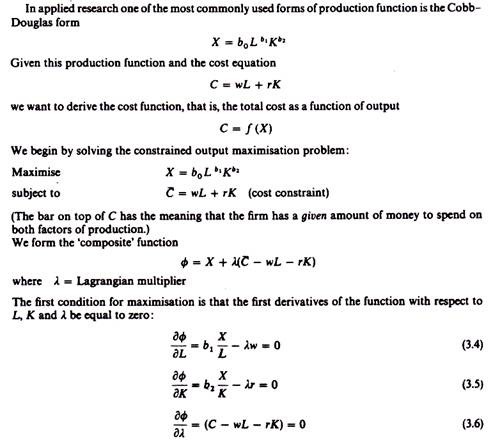
B. Formal Derivation of Cost Curves from a Production Function:
Rearranging the expression above we obtain:
This is the cost function, that is, the cost expressed as a function of:
ADVERTISEMENTS:
(i) Output, X;
(ii) The production function coefficients, b0, b1, b2; (clearly the sum b1 + b2 is a measure of the returns to scale);
(iii) The prices of factors, w, r.
ADVERTISEMENTS:
If prices of factors are given (the usual assumption in the theory of the firm), cost depends only on output x, and we can draw the usual diagrams of cost curves, which express graphically the cost function
C = f(X) ceteris paribus
‘Ceteris paribus’ implies that all other determinants of costs, that is, the production technology and the prices of factors, remain uncharged. If these factors change, the cost curve will shift upwards or downwards.


