In this article we will discuss about the conditions for maximising total revenue in agriculture business.
For determining the combination of two products, produced with the help of given resources which yield the maximum total revenue, we use the same procedure as was adopted for minimizing the total cost.
Here, the object of the farmer is to produce a combination of two products, say, Y1 and Y2 which takes him on to the highest possible iso-revenue line based upon the given prices of these two products. The required combination of Y1 and Y2 at the same time has to be the one, on the given production possibility curve (based upon the given units of an input, say x1).
Profit Maximization when Promotion Possibility Curve is Concave to the Origin:
If we assume that the production possibility curve is concave to the origin, this condition will obviously be satisfied when one of the iso-revenue lines is tangent to the given (concave to the origin) production possibility curve.
ADVERTISEMENTS:
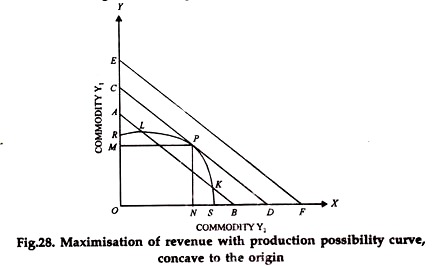
The diagram (Fig. 28) shows how the point of maximum total revenue is achieved when the production possibility curve and a set iso-revenue lines is given. The diagram has been drawn on the assumption that the two products Y1 and Y2 are competitive products. In other words, the production possibility curve shows a stage of rational production throughout.
In the diagram, AB, CD and EF ne three iso-revenue lines, based upon the given prices of the products Y1 and Y2 EPS is the production possibility curve. Iso-revenue line AB intersects the production possibility curve at points L and K. In other words, if the farmer products a combination of y1 and y2 represented by point L or by point K, he will get total revenue represented by the iso revenue line AB.
Obviously, this is not the maximum total revenue. He can get a higher total revenue if he judiciously chooses some other combination of the products. He will reach the highest achievable iso-revenue line CD when he produces a combination of two products represented by point P.
ADVERTISEMENTS:
With the given production possibility curve, iso-revenue line EF is beyond the reach of the farmer. So, point P represents the optimum combination of two products. The farmer will produce OM units of Y1 and On units of Y2 and will get the maximum total revenue.
The main feature of point P (as is clear from the diagram) is that at this point, one of the iso-revenue lines is tangent to the given production possibility curve. In other words, the slope of the production possibility curve at this point is the same as the slope of the iso-revenue line.
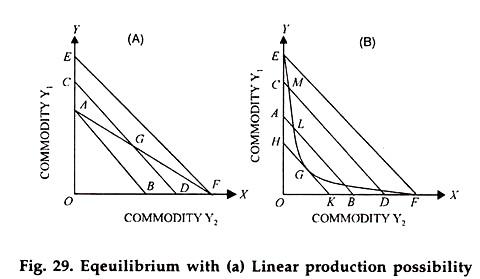
In case of Fig. 29 (a) and only Y1 (OE amount) in case of Fig. 29 (b) if he has to be on the highest iso-revenue line (EF in both cases). If the slopes of the iso-revenue lines were different, the equilibrium might have been found on the other extremes in both the cases.
It is obvious that the tangency conditions, derived earlier in the case where the production possibility curve was concave to the origin, are no longer valid.
ADVERTISEMENTS:
In case of a straight line production possibility curve, the iso-revenue line will not be tangent to it at all if the slope of the former is different from the slope of the latter. And, in case of a production possibility curve, convex to the origin, tangency condition shows the minimum total revenue rather the maximum total revenue (As point G in Fig. 29(b).]
Revenue Maximization in Case of Complementary or Supplementary Products:
So far, we have considered how the combination ensuring the maximum total revenue is determined if the two products are competitive (whether the production possibility curve is concave or convex to the origin or is a straight line). We shall now discuss how the optimum production combination is determined when the two products are supplementary or complementary to each other.
We shall be discussing the determination of equilibrium for both type of products (for product-product relationship) together because the same analysis and the same conclusions are valid for both types of products.
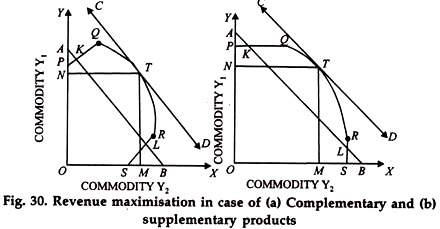
The following diagrams 30(a) and 30 (b) show the conditions for maximization of total revenue in case of complementary products and supplementary products respectively. PQRS is the production possibility cure both in Fig. 30 (b). Whereas the production possibility curve in Fig. 30(a) shows that the two products are complementary to each other, that in Fig. 30(b) shows that the two products are supplementary to each other.
AB and CD are two iso-revenue lines in both the figures that equilibrium will be at point T which will indicate a product combination of ON of Y1 and OM of Y2. Now, point T is in that segment of the production possibility curve where the products Y1 and Y2 are competitive.
Any point which will fall in the segments PQ or RS i.e., where the two products are complementary or supplementary will always be on the lower iso-revenue line (as it is shown by points K or L) whatever be slope of the iso-revenue line provided it continues to be negative & finite. And it cannot be denied that the slope of the iso-revenue line will always be negative & finite is the prices of the two products are non negative and also Non zero.
Even, otherwise as we have already pointed out earlier, the segments PQ and RS of the production possibility curve (Fig. 30(a) or Fig.30 (b)) are segments indicating irrational production and in order to maximize his total revenue, a farmer must pass over from these already stated, the segment of rational production in a production possibility curve covers only that part of it where the two products are competitive.
Revenue Maximization in Case of Joint Products:
ADVERTISEMENTS:
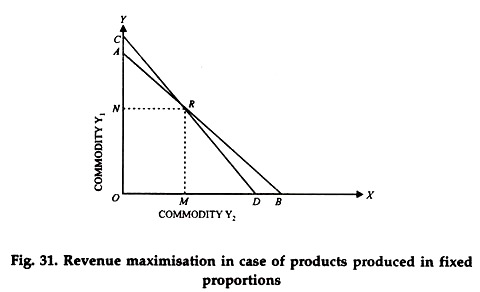
The last category of product-product relationship to be analyzed is that of joint products. The joint products are produced in fixed proportions. This, as we have stated earlier means that the production possibility curve will consist of one point only.
In diagram (Fig. 31) with a given input, a combination of ON of Y1 commodity and OM of Y2 commodity can be produced. Point R indicates this combination. As it is a case of joint products, produced in fixed proportions, there is another combination that can be produced with the same input.
It is evident that whether the iso-revenue passing through the point R is AB or CD, will be the highest iso-revenue line of its set (i.e., all iso-revenue lines based upon the same given prices) that can be reached with the given combination of the two products.
Of course, we should note that though maximum in both the cases, the total revenue represented by these two iso- revenue lines can be different in amount. It will all depend upon on the given prices of the two products.
ADVERTISEMENTS:


