In this article we will discuss about the stages of rational and irrational production in an isoquant.
We know that the marginal productivity of each input taken in isolation is positive. But it is quite possible that at a particular point, its marginal productivity is falling, (as is generally the assumption) may become Zero and later on, negative.
Now, what happens when the marginal productivity of an input, say x2 becomes zero? The addition of a unit of x2 with zero marginal productivity does not add anything to the total output. This will mean that the other input i.e., x1 should not be reduced at all if the total output has to remain the same.
We shall say that at this point the marginal rate of technical substitution of x2 for x1 is i.e., – becomes zero. And if still more units of x2 are used (now with negative marginal productivity) we will have to increase rather than reduce the amount of input x1 which still has a positive marginal productivity, in order to keep the total output at the same level.
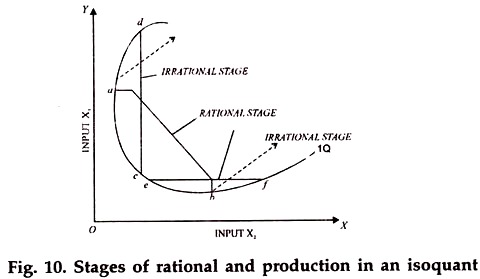
In other words, after this point, the slope of the isoquant will become positive i.e., it will be moving upwards to the right. The same trend in the slope of an isoquant will be found if instead of x2 x1 is successively increased beyond a point where its marginal productivity is Zero and consequently where is also Zero. An extended isoquant will appear as in the diagram given below.
This diagram, in a way contradicts the contention that an isoquant generally slopes downwards to the fight and is convex to the points ‘a’ and ‘b’ in the diagram. These two points represent the combinations where marginal rate of substitution becomes Zero is Zero at point ‘a’ and
is Zero at point ‘b’.
Between a’ and ‘b’ if we increase the quantity of one input, we shall decrease the quantity of the other in order to keep the output at the same level, i.e., the one represented by the given isoquant. Points ‘a’ and ‘b’ indicate the limits of substitutability between the two inputs.
Beyond ‘a’ and ‘b’ we must increase both the inputs to keep the total output at the same level. In fact, the segments of the isoquant beyond ‘a’ and ‘b’ are called stages of irrational production. These are stages of irrational production because to each combination of the inputs in these segments, there corresponds a combination in the segment of rational production which while using the same amount of one input, uses less amount of the other input.
ADVERTISEMENTS:
(Sometimes, even both the inputs may be used in smaller quantities). For example, point ‘c’ which lies in the ‘rational stage’ uses less of input x1 through it uses the same amount of x2 when compared with point ‘d’ which lies in the stage of irrational production.
Similarly point ‘e’ uses less of input x2 when compared with point ‘f’ in the irrational’ stage. If the isoquants are fully extended, they may assume a shape somewhat circular in nature. However, the part of an isoquant beyond ‘a’ and ‘b’ will represent stages of irrational production.
A rational entrepreneur will not operate in these parts of an isoquant. For him, only the isoquant between ‘a’ and ‘b’ is relevant for operation and this is the reason why we say that an isoquant always slopes downward to the right and is generally convex of the origin. Such an isoquant always represents a stage of rational production.
In some cases, an isoquant (in the stage of rational production) can be a straight line or even concave to the origin:
ADVERTISEMENTS:
We have already stated that the segment of an isoquant showing stage of rational production always slopes downwards to the right. This is because in this part of the segment both the inputs have positive marginal productivity. However, it is not always necessary that the positive marginal productivity of an input should decline with every successive increase in its amount.
It can remain constant or can even increase. In that case, the marginal rate of technical substitution will not decline as we have shown above. If the marginal productivity of both inputs remains constant, the amount of one input say x1 to be given up when the other input x2 is successively increased will not decline.
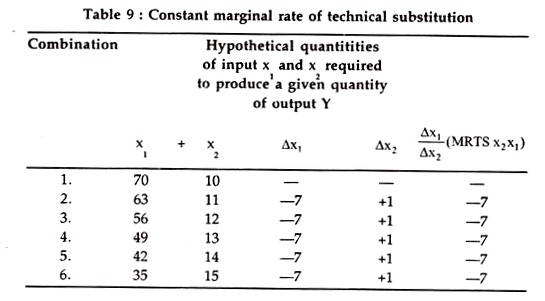
Rather it will remain constant. In other words, the marginal rate of technical substitution will remain constant. In such a case, the isoquant will be a straight line, sloping downwards to the right. The following table and the accompanying diagram give an illustration of a straight line isoquant.
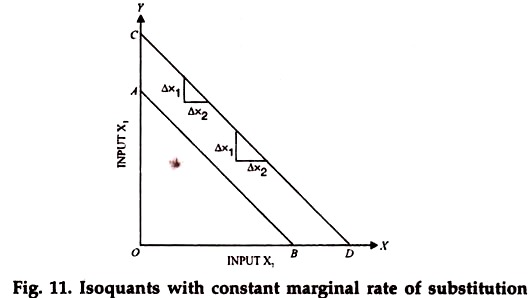
It is clear from the above table that for every addition of one unit of input x2 seven units of input x1 are to be given up so that the total production may remain the same. In other words, the marginal rate of technical substitution is constant. This rate, as already explained is constant because the marginal productivity of both the inputs, taken individually, is constant. Following diagram shows a few straight line isoquants.
It is clear that at every point on the isoquant, its gradient, showing the marginal rate of technical substitution (i.e., or
) is the same and any curve with a constant gradient at various points is nothing but a straight line. An isoquant can sometimes be concave to the origin also. Such an isoquant emerges when the marginal productivity of each of the inputs is positive and increases as quantity of the concerned input is increased.
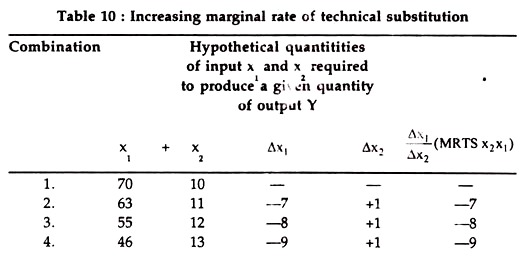
As the use of every successive units of an input say x2 adds to the total output at an increasing rate, more of the other input i.e., x1 will have to be successively given up in order to keep the total output at the same level. In other words, marginal rate of technical substitution will successively increase as the amount of one input in the combination is increased. The following table describes a situation of increasing marginal rate of technical substitution.
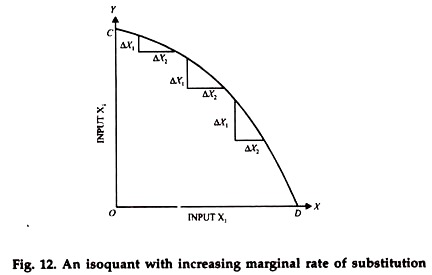
If we plot the combinations of two inputs given above and join the points representing them, we shall get a curve (an isoquant) as shown in diagram 12.
The diagram shows that the marginal rate of technical substitution (i.e.,) is increasing as x2increasing as x2increases. As (
or
) also shows the gradient of the curve drawn, we can say that gradient changes in this manner, is bound to be concave to the origin.
Isoquants can sometimes be represented by a point only (A case of inputs used in fixed proportions). So far, we have been discussing the shape of an isoquant on the assumption that there are many combinations of two inputs which can be used to produce a given amount of a product. Such an assumption always results in an isoquant which will be either a curve or a straight line in shape.
ADVERTISEMENTS:
However, sometimes one comes across a process of production where a given amount of a product can be produced only by one combination. No other combination can be used to produce that amount of the product (e.g., one tractor can be combined with one driver or two tractors can be combined with two drivers only, for a particular operation). In other words, it is a case where a product can be produced only when the inputs are combined in a fixed proportion.
The inputs in such a case are complete complements to each other and no additional product is produced when the amount of only one of the inputs in the given combination is increased. In such cases, the isoquant is, in fact, represented by only one point corresponding to the given fixed combination of two inputs.
Another isoquant will be represented by another point representing another combination (used in fixed proportions). However, in order to give such an isoquant a semblance of a curve, we may have the exercise of changing the composition of the inputs.
Suppose input x1 is increased. We cannot decrease the input x2 as addition in x1 by itself, does not add anything to the amount of product already produced (It is a fixed proportion combination).
ADVERTISEMENTS:
Similarly, any .addition in x2 will not require any reduction in In other words, symbolically, various combinations producing the same amount of output, in case of production by inputs combined in fixed proportions will be represented by two lines perpendicular to each other emanating from the point representing the actual combination.
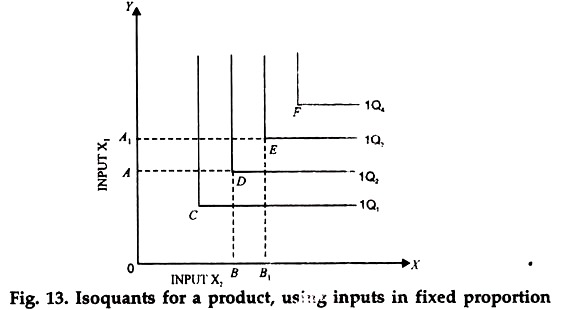
Or we can say that in case where the product is produced by a combination of inputs used in a fixed proportion, the isoquant takes the form of a right angle-right angled at the point representing the actual combination. All the combinations, other than the actual combination can be said to lie in the segments indicating irrational production. The following diagram shows a few isoquants of type.
In the diagram, Isoquants IQ1, IQ3 etc. represent the isoquants where output is produced by inputs x1 and x2 combined in fixed proportions.
For example, for output represented by IQ2, the only rational combination of inputs consists of OA of x1 and OB of x2 Other combinations of inputs on this isoquant are irrational simply because they unnecessarily use more of one input while the amount of the other input in combination remains the same.
The foregoing discussion throws light on the different types of factor- factor relationship that can be found in actual practice. To sum up, these relations can be represented by isoquants sloping downwards to the right and at the same time, being (a) convex to the origin or (b) straight line or (c) concave to the origin or (d) bent towards the origin at right angles (with only the point of right angle representing the combination for rational production.)
ADVERTISEMENTS:
The Iso Cost Lines:
As we know, the object of the present analysis is to find out the conditions under which the combination of two inputs, used to produce a given amount of output will involve the minimum cost of production, given that the price per unit of each input remains the same. For this purpose, we are required to know not only about the concept of an isoquant but also about what is known as iso-cost line.
Just as an iso-product curve can be used to indicate all possible combinations of two variable factors which will produce the same level of output, an iso-cost curve can be drawn to indicate various combinations of two variable inputs which can be purchased with the same amount of money.
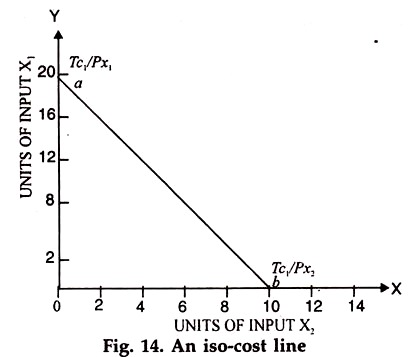
In other words, an iso-cost curve (in fact, it will be a line if the prices of the two inputs are fixed) contains all those points which represent various combinations of two variable inputs that cost the same amount.
Here, total cost is a function of the quantities of two inputs, say, x1 and x2 and it can be graphed in a manner similar to that adopted for drawing various isoquants.
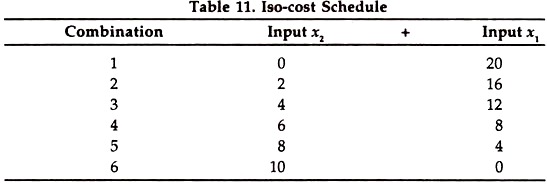
Suppose, a farmer has Rs. 80 to spend upon two variable factors, x1 and x2. Further suppose that the price of one unit of x2 is Rs. 4.00 and that of one unit of x2 is Rs. 8.00. He can buy the following combinations of two inputs. There are many other combinations which have not been given in the table.
All the above 6 combinations of two variable inputs, x1 and x2 cost the same amount. An iso-cost line drawn for Rs. 80 is shown in Fig. 14.
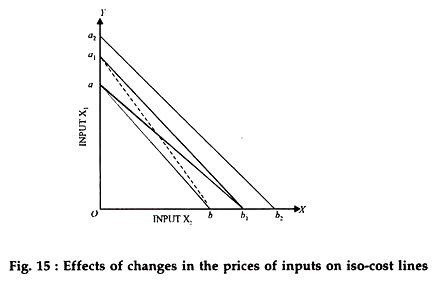
Changes in input prices change the position as well as the slope of the iso- cost line. A reduction in input price means that more can be purchased with the same total outlay whereas an increase in input prices means that less can be purchased. For example in fig. 15.a b is the original iso-cost line.
If the price of input x1 falls, price of x2 remaining the same, ab1 would represent the new iso-cost line. Similarly if the price of x2 fall while the price of x1 remains the same ab1 will be the new iso-cost line. If prices of both the inputs i.e., x1 and x2 fall, we may get either a1 b1 or a2 b2 or some other line as the new iso- cost line, depending upon the extent of fall in the price of the two inputs.
Least cost combination of two inputs:
ADVERTISEMENTS:
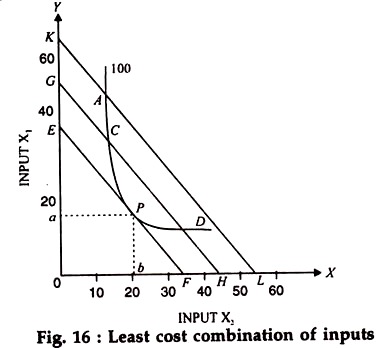
We are now fully equipped to find out the least cost combination, required to produce a given amount of a product. Suppose we have an isoquant showing an output of 100Z (s shown in diagram 16) produced by various combinations of two inputs namely and x2. The isoquant is convex to the origin and segment of rational production.
It is clear that the amount 100Z of the product can be produced by various combinations of x1 and x2 e.g., those represented by point A, C, P and D. At the given prices of the two inputs, the total cost of using these combinations will obviously be different.
The problem before us is as to which of the various combinations be actually used to produce 100Z if the total cost is to be the minimum. For this purpose, we have to draw and superimpose a set of iso- cost lines based upon the prevailing prices of x1 and x2 on the given isoquant.
Three such lines have been shown in the diagram. As all of these iso-cost lines are upon the given prices of the two inputs, these are parallel to each other. Of course, the higher iso-cost line shows the higher total cost.
It is evident from the diagram that only the combination of inputs represented by point P (oa of x1 and on of x2) on the isoquant will involve the minimum cost as it happens to be on the lowest iso-cost line. The cost of all other combinations required to produce 100Z is higher because the points representing them fall on higher iso-cost lines.
ADVERTISEMENTS:
The preceding diagrammatic explanation leads us to one conclusion. It is that on a given isoquant (which is convex to the origin) only that point will indicate the minimum cost combination of two inputs where one of the iso- cost lines is tangent to this isoquant.
Conditions for Minimisation of cost when isoquants are straight lines, or concave to the origin:
Whether the isoquants are convex to the origin or otherwise, minimisation of cost requires that the point representing the desired combination of inputs should lie on the lowest possible iso-cost line. In case of a convex isoquant this condition will be satisfied at a point where one of the iso-cost lines is tangent to the given isoquant.
In case of an isoquant, concave to the highest iso-cost line. In such a case the minimum cost combination will obtain at one of the extreme points of the given isoquant, either on X-axis or Y-axis depending upon which of its two extreme points coincides with the lower iso-cost line. This will be clear from diagram 17
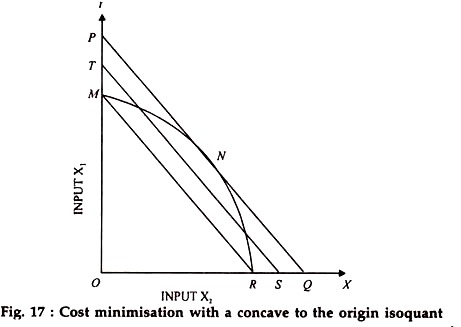
This, in fact, means that only input x1 in this case, will be used for production. If the curvature of the concave isoquant or the slope of the iso-cost line were different, the point on the isoquant coinciding with X-axis i.e., the other extreme point on the isoquant could fall on the lowest iso-cost line.
Straight line isoquant and the minimum cost of production:
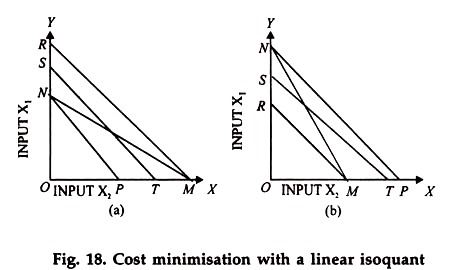
In this case also, the combination involving the minimum cost of production will be represented by only one of the extreme points of the isoquant, lying either on X-axis or Y-axis. Which of the two points is to be finally selected, depends upon the slope of the isoquant and that of the iso-cost line. This will be clear from the following diagrams 18 (a) and 18 (b).
In both the diagrams, NM is the isoquant and NP, ST and RM are the iso- cost lines. Due to difference in the slope of the is iso-cost lines and the isoquant, whereas the minimum cost combination of inputs includes only input x (ON units) in Fig. 18(a) it contains only x input (OM units) in Fig.18(b).
Minimisation of cost in case of products requiring inputs in fixed proportions:
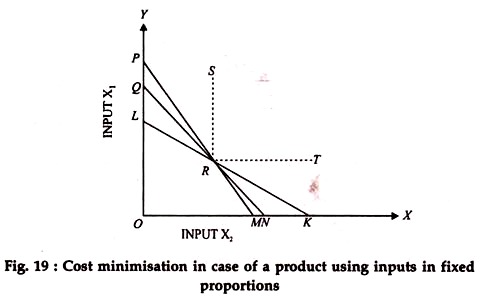
As we have already explained, in case, the product is produced with inputs required in fixed proportions, the isoquant is represented a point and obviously the combination of inputs represented by such a point will show the minimum cost, whatever be the prices of the two inputs.
Diagrammatically, we can show the point of equilibrium as follows.
In the above diagram, SRT is the isoquant, showing the combination for rational production only at point R. Whether the iso-cost line is LK or QN or PM, point R will show the minimum cost combination of inputs under any given situation.
The expansion path:
The cost of producing a particular amount of output can be minimized if the prices of two inputs are given. However, the farmer may like to change the level of output itself.
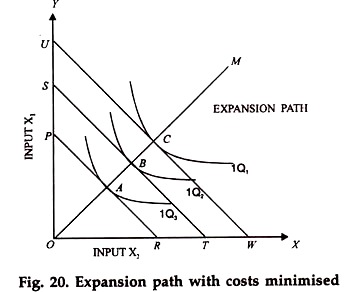
Each level of output, one can be represented by an isoquant and for each level of output, one can also find with the help of iso-cost lines, a combination which results in the minimum cost of production. The following diagram shows these minimum cost points for certain levels of output represented by various isoquants.
In the diagram, we find that at the given prices of the two inputs x1 and x2 A,B and C are the three points showing minimum cost of production when the level of output is respectively represented by IQ1 IQ2 and Q3 .
There can be many other such equilibrium points. If we join all these points of equilibrium, we get what is known as the expansion path. It can be in the form of a curve or a straight line, depending upon the slope of various isoquants. The expansion path shows what amount of two inputs a farmer should use, if he wants to produce more but without losing sight of the objective of minimising the cost of production.
The isocline:
The curve OM, in the above diagram (the expansion path) is also called an isocline. An isocline is a line (or a curve) joining those points on various isoquants (or such other contours) where the slope of these isoquants is the same (cline indicates inclination or slope).
An isoquant map can have an infinite number of isoclines. However, at one point of time, only one of them can represent an expansion path. It will be that which joins those points on different isoquants where their slope is just equal to the slope of the iso-cost line based upon actually prevailing prices.
