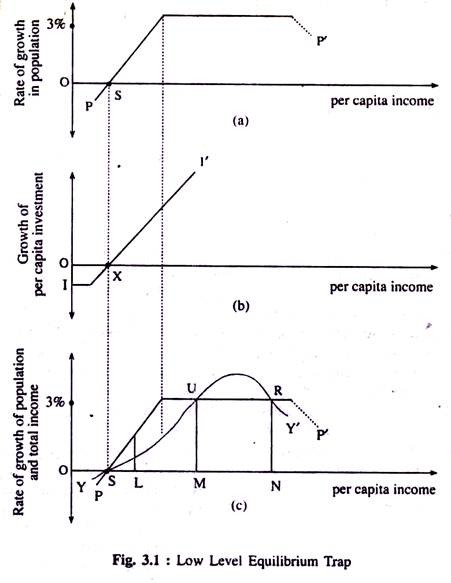
This article provides a note on Malthusian trap or low level equilibrium trap.
An underdeveloped economy reels under the vicious circle of poverty. How an underdeveloped economy is caught in the low level equilibrium trap has been lucidly explained by R. Nelson.
His model tries to integrate population and development theories by recognising the interdependence between population growth, per capita income, and national income growth.
Nelson’s thesis is based on two propositions:
ADVERTISEMENTS:
(i) Nelson and H. Leibenstein put forward the proposition that population will increase when per capita income of a country rises above the minimum subsistence level. But they believed that while initially population grows rapidly with a rise in per capita income, there is an upper limit to the rate of population growth, say at about 3 p.c. per annum. Beyond this limit, a rise in per capita income will not be accompanied by a further rise in the rate of growth of population. On the contrary, the rate of growth of population may even fall with every increase in per capita income. (At high levels of income, people want to keep the size of the family in check so as to Maintain a high standard of living.)
(ii) The second proposition is based on Nurkse’s concept of the vicious circle of poverty. Nurkse pointed out that at low levels of per capita income, people are too poor to save and invest much. This low rate of investment, in its turn, will result in a low rate of growth but as the per capita income rises above a certain minimum level at which there is zero saving a rising proportion of the total income will be saved and invested (because the marginal propensity to consume falls and the marginal propensity to save rises with an increase in income above a certain level). This will, ultimately, lead to a higher rate of growth in income.
Fig. 3.1 having three interconnected parts illustrates the above argument. In Fig. 3.1(a) we measure per capita income on the horizontal axis and the rate of growth of population (in percentage term) on the vertical axis. The point S denotes the minimum subsistence level of per capita income. Below this level of income (i.e., to the left of point S) population will be decreasing, and at point S, it will remain unchanged. However, as we move to the right of S, denoting a rise in the per capita income above the subsistence level, population will increase (as is shown by the PP’ curve) until it reaches the upper limit of 3 p.c. after which it may gradually decline.
In Fig. 3.1 (b) we measure the level of per capita income on the horizontal axis, and, on the vertical axis, we measure per capita investment out of savings at different levels of per capita income. The point X denotes that level of income at which saving is zero.
ADVERTISEMENTS:
If income is less than this, saving and investment will be negative. Society will have to live on past capital. But as the economy moves to the right of X, denoting a rise in per capita income above the zero saving level, the per capita rate of investment, the II’ curve, will rise. And this process will continue. As we move to the right of X, a rising proportion of the total income will be saved and invested. This actually happens beyond the point at which the rate of growth in population levels off at 3 p.c.
In Fig. 3.1(c), the vertical axis measures the percentage rate of growth of income and population while the percentage rate of growth in total income at the different levels of per capita income have been shown along the horizontal axis. The point S (equal to X) on the horizontal axis represents the low level equilibrium trap.
It denotes the intersection of the PP’ curve (showing population growth) with the income growth curve YY’ at the zero rate of growth. If we start from this, for any small rise in the level of per capita income, say SL, the rate of growth of population will exceed that of total income. This will drive the per capita income back to its previous stable equilibrium level of OS.
ADVERTISEMENTS:
In the language of H. Myint:
“This low level equilibrium trap will be stronger the more quickly the rate of population growth responds to a given rise in per capita income and the more slowly the rate of growth in total income responds to a increase in investment, due, say, to initial population pressure on land.”
Now, if it is possible somehow to raise the level of per capita income by a discontinuous jump by more than SM, i.e., if we can raise the growth rate of per capita income beyond the population barrier of 3 p.c., then we should be able to reach a new unstable equilibrium at U. This increase in per capita income, in the absence of a further rise in the rate of population growth, would then lead to a cumulative process of rising income until possibly it reached a new stable equilibrium point R with a per capita income level of ON.
This critical minimum effort or big push theory provided us a clear idea of the vicious circle of low per capita income. The origin of big push theories of development and the concept of a critical minimum effort is the belief that, to escape from Nelson’s trap, it will be necessary to raise the per capita income above OM in one go.
