In this article we will discuss about the Indifference Curve Theory of Consumer Behaviour, explained with the help of suitable diagram.
In the indifference curve theory of consumer behaviour, it is assumed that the consumer buys only two goods. This assumption is necessary for two-dimensional graphical illustrations of the theory. Suppose that the consumer buys the goods, X and Y.
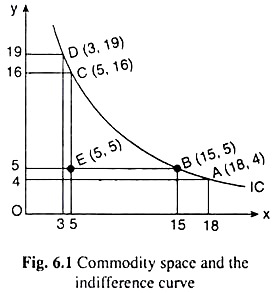
The quantities of these goods are measured along the axes of a two-dimensional plane, called the commodity space. This is shown in Fig. 6.1. Any point in this commodity space represents a combination of the goods X and Y. For example, in Fig. 6.1, the point E represents a combination (x = 5, y = 5), or, simply (5, 5) and the points B and C represent, the combinations (15,5) and (5, 16) respectively.
By axiom ofcompleteness of consumer preferences, the consumer is able to make or express neutrality between any two points or combinations in the commodity space.
ADVERTISEMENTS:
For example, the consumer may tell us that he prefers point B (15,5) to point E (5,5), i.e., he obtains a higher level of utility at B than at E, or, he may tell us that he is indifferent between the points B (15, 5) and C (5,16), i.e., these two points give him the same ordinal level of utility.
Now suppose that the consumer tells that he is indifferent between the combinations A (18, 4), B (15, 5), C (5,16) and D (3,19). Join these (and all such) points by a curve, is known as an Indifference Curve (IC).
The definition of an indifference curve in this way can be given. If the consumer expresses his indifference between a number of combinations of two goods, say, X and Y, then the curve that would be obtained by joining these combinations, is an indifference curve. In other words, the consumer derives the same level of satisfaction from the points that lie on an indifference curve.
ADVERTISEMENTS:
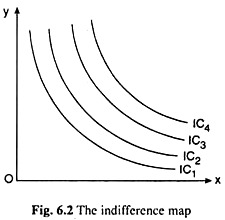
Similarly, the consumer may tell that he obtains another level (different from the previous level) of satisfaction from some other points. Join these points by a curve, another indifference curve is obtained. In the same way, many other ICs can be obtained, each representing a particular level of satisfaction.
A collection of the ICs of a consumer in a single diagram is known as his indifference map. Such an indifference map has been shown in Fig. 6.2. Assume here that ICs are negatively sloped, convex-to-the-origin and non-intersecting curves, and a higher IC, i.e., one farther from the origin represents a higher level of satisfaction.

