Learn about the Graphical Representation of Consumption and Saving.
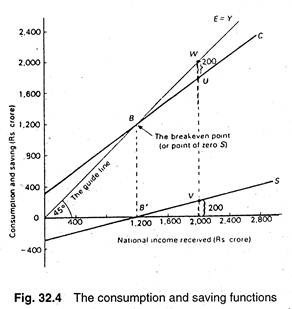
The data on consumption and saving given in Table 32.1 may be plotted graphically. This is done in Fig. 32.4. The line C is the consumption function. It shows the relation between planned consumption expenditure and national income. In a like manner the saving function 5 shows the relation of planned saving to national income. As income increases both consumption and saving rise.
In Fig. 32.4 we also draw a 45° line. It may be called a guideline. It is not a line that shows any planned expenditure. Instead it is the locus of all those points at which the values measured on the two axes are equal. In other words, it is the locus of points where planned expenditure equals national income. The line is always labelled E = Y. If we use the same scale on the two axis it will obviously be a 45° line with a slope of +1.
ADVERTISEMENTS:
The 45° guideline (or reference line) is very useful for a study of consumption and saving functions. Firstly it enables us to locate the break-even point. In Fig. 32.4, B is the break-even point or the point of zero saving. It is the point at which Y = C, and S = 0.
Secondly, if we draw a perpendicular from point B we get a corresponding point on the horizontal axis (B’). The saving function S start from this point. To the left of this point saving is negative and to the right of the point saving is positive. This implies that national income must reach a minimum level for any saving to occur.
In Fig. 32.4 national income must exceed Rs. 1200 crores for saving to be positive. Thirdly, as we know that saving is that part of national income which is not spent on consumption goods, the vertical sums of the S and C must, by definition, coincide with the 45° line. In other words, at any level of income, saving is the vertical distance between the 45° line and the C line.
In Fig. 32.4, we observe that when national income is Rs. 2000 crores consumption spending is Rs. 1800 crores (point u) and saving Rs. 200 crores (point u).
ADVERTISEMENTS:
This saving of Rs. 200 crores may also be shown by the gap between the consumption line and the 45° line (the distance u to w). This is an alternative way of stating that at any level of national income, total income must by definition be equal to the amount consumed and the amount saved.
Keyne’s sums up the main points as follows:
ADVERTISEMENTS:
Keynes’ Hypotheses about MPC and MPS:
The MPC and the MPS are always greater than zero and less than one.
The sum of the MPC and the MPS must always equal 1.
The MPC is the slope of the consumption function, and the MPS is the slope of the saving function.
The MPC and the MPS are relatively constant; their values do not change along the consumption- function line.
Basic ideas about the Keynesian Consumption Function:
Consumption (C) depends on the level of disposable income Yd.
Part of consumption (C0) is independent of the level of income. C0 changes in response to changes in wealth, interest rates, the price level, price expectations, and other factors.
The rest of consumption (bYd) is positively related to income, b is the fraction of an additional dollar of income that will be spent on consumption: 0 < b < 1.
