The below mentioned article provides an overview on consumer surplus.
Definition Of Consumer’s Surplus:
The demand curve for a normal good is downward sloping due to the law of diminishing marginal utility.
From the negative slope of the demand curve Alfred’ Marshall developed a famous concept, viz., consumer’s surplus. In the language of Paul Samuelson, “We enjoy consumer surplus basically because we pay the same amount for each unit of a commodity that we buy, from the first to the last. We pay the same price for each egg or glass of water. Thus we pay for each unit what the last unit is worth. But by our fundamental law of diminishing marginal utility, the earlier units are worth more to us than the last. Thus, we enjoy a surplus of utility on each of these earlier units.”
According to R. G. Lipsey, “Consumer’s surplus is a direct consequence of downward- sloping demand curves.” It can be defined as the extra satisfaction or utility gained by consumers from paying an actual price for a good which is lower than they would have been prepared to pay. The surplus arises because we receive more than we pay for as a result of the law of diminishing marginal utility.
Illustration:
ADVERTISEMENTS:
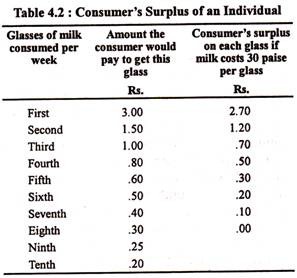
The concept may now be illustrated, first by giving a numerical example and then graphically. Suppose a consumer is ready to pay Rs. 3. for glass of milk that he is willing (eager) to consume. Since the second glass gives him less utility than the first glass, he will be ready to pay less. This follows from his negatively sloped demand curve which is indeed the marginal utility curve. Suppose he is ready to pay Rs. 1.50 for the second glass.
Since every extra glass of milk gives him less and less satisfaction he will be ready to pay less and less for every extra glass of milk that he wants to drink. Suppose he is willing to pay Re. 1.00 for the third glass, 80 paise, 60 paise, 50 paise, 40 paise, 30 paise, 25 paise and 20 paise for the successive glasses from the fourth to the tenth per week. The total utility that he derives from the consumption of 10 glasses of milk per week is to be found out by adding up what he is ready to pay for each unit.
The result is shown in table below:
Suppose, the market price of milk is 30 paise per glass. The difference is the maximum price our representative consumer is willing to pay and the actual market price measures consumer’s surplus per unit. The total consumer’s surplus can also be calculated from the table by adding up the figures of column 3.
ADVERTISEMENTS:
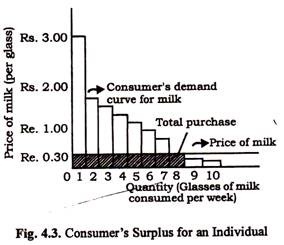
The law of diminishing marginal utility and the negatively sloped demand curve derived there-from indicates that a representative consumer will be ready to pay less and less for every additional glass of milk consumed. As long as he is ready to pay more than the market price for any glass, his consumer’s surplus (when he buys it) will be positive, hi our example, the marginal glass is the eighth.
The marginal utility of this glass is exactly equal to its market price. So no surplus is gained from the consumption of the unit. Since the marginal utility of the ninth or tenth glass is less than the price of milk, the consumer will not buy more than eight glasses. So the eighth glass is the last glass that he will buy.
In the example the total utility derived by the consumer from 8 glasses is Rs. 8.10 and total money spent on these is Rs. 2.40. So the difference between the two is Rs. 5.70 per week. This is indeed consumer’s surplus for an individual. Fig. 4.3 illustrates the concept. It is based on data of Table 4.1. The entire area above the shaded area is consumer’s surplus, i.e., area above the market price.
ADVERTISEMENTS:
As Lipsey has put it, ‘consumers’ surplus is the sum of the extra valuations placed on each unit above the market price paid for each. In general consumer’s surplus is the difference between total utility derived from the consumption of all the units of a commodity and total payment made to acquire those units. As Samuelson has put it, “because consumers pay the price of the last unit for all units consumed, they enjoy a surplus of utility over cost. Consumer’s surplus measures the extra utility that consumers receive over what they pay for a commodity.”
Two Points:
Two points may be noted in this context:
1. Utility surplus:
Consumer’s surplus is basically utility surplus and cannot be measured accurately. It is so because utility is a subject concept and cannot be objectively measured.
2. Price changes:
A price fall leads to an increase in consumers’ surplus and a price rise leads to a fall in consumers’ surplus. Thus in our above example if the price of milk falls to 25 paise, the ninth glass will be consumed. If price falls further to 20 paise even the tenth glass will be consumed. Consumer’s surplus will now increase because the consumers will earn more and more surplus from each unit.
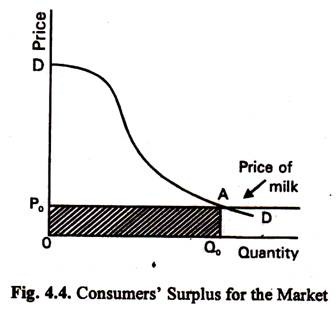
Fig. 4.4 shows consumers’ surplus for the market. It is measured by the area below the market demand curve DAD but above the market price P0. In fact, the total area under the demand curve is OPaAq0 (when consumers buy q0 units). Total expenditure is OP0AQ0 (at the market price P0). So consumers’ surplus is the area P0DA.
ADVERTISEMENTS:
To conclude with Samuelson:
“The concept of consumer’s surplus points to the enormous privilege enjoyed by citizens of modern societies. Each of us enjoys a vast array of enormously valuable goods that can be bought at low prices.”
Some Applications of the Concept:
The concept of consumer’s surplus can be applied to throw light on some important economic problems.
We consider the following application here:
The Paradox of Value:
ADVERTISEMENTS:
The classical economists like Adam Smith and David Ricardo were surprised by the fact that the price of a highly essential item of consumption like water was much less than the price of a luxury good like diamond. So a basic paradox was encountered, known as the paradox of value or water-diamond paradox.
The paradox can be resolved by referring to an important proposition developed by the neoclassical economists like Alfred Marshall, that the value (price) of a good is determined by its relative scarcity rather than by its utility (usefulness). Water is extremely useful and its total utility is high. But, because it is abundant, it’s marginal utility (and hence, price) is low. But by contrast, diamonds are much less useful than water but their great scarcity makes their marginal utility (and hence, price) high.
Marginal Utility and Price:
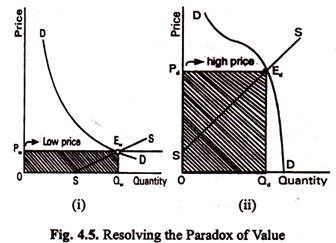
Thus the fact is that the price of a commodity is determined, at least from the demand side, not by its total utility but its marginal utility. The marginal utility derived from the consumption of one extra unit of a commodity indicates how much a consumer is ready to pay for that unit. This point is illustrated in Fig. 4.5.
Part (i) shows that when the consumption of water is very high (Qw units), total utility is very high but marginal utility is very low (Ew Qw. So consumers are ready to pay a price of only PW per unit.
ADVERTISEMENTS:
By contrast part (ii) shows that when consumers are willing to buy Qd units of diamonds, total utility is low but marginal utility is Ed Qd, which is very much on the high side. So consumers are willing to pay a price of Pd per unit (to acquire the limited amount of diamonds that is available).
However, actual price is determined largely by scarcity. So whether price will be high or low depends on its scarcity and is indicated by its market supply curve. The consumer’s surplus of water is immense while that of diamonds is low. Now the supply curve of water indicates that water is abundant and so its price is low. Thus, when the market for water reaches equilibrium at Ew the total expenditure on water is the area OPw EwQw which is on the low side.
The supply curve of diamonds makes it scarce and accounts for its high price. Thus when the market for diamonds reaches equilibrium at point Ed its price is quite high. So total expenditure on diamonds is also high, and is indicated by the area OPd EdQd.
Thus Fig. 4.5 shows that the supply and demand curves for water intersect at a very low price while supply and demand curves for diamonds are such that the equilibrium price of diamonds is quite high. It may be noted that supply and demand curves for water intersect at such a low price and that of diamonds at a high price because diamonds are very scarce and the cost of getting extra ones is very much on the high side while water is relatively abundant and costs little in most parts of the world.
But this is not the whole truth. The fact is that the utility of water as a whole does not determine its price or demand. Rather water’s price is determined by its marginal utility, by the usefulness of the last glass of water. Because there is so much water, the last glass can hardly fetch any price in the market place.
ADVERTISEMENTS:
Even though the first few drops can save a life, the last few are needed only for watering the lawn or washing clothes. We thus find that an immensely valuable commodity like water sells for nothing because its last drop gives no extra utility (i.e., its MU is almost zero).
The paradox of value can be resolved as follows:
“The more there is of a commodity, the less is the relative desirability of its last little unit. It is therefore clear why a large amount of water has a low price and why an absolute necessity like air could become a free good. In both cases, it is the large quantities that pull the marginal utilities so far down and thus reduce the prices of these vital commodities.”


