Consumption is the use of utility for the direct satisfaction of wants. In simple words, it is the quality of a product to satisfy human wants.
According to Marshall, “Consumption may be regarded as negative production.”
According to Meyers, “Consumption is the direct use of goods and services in satisfying the human wants.”
Consumption is an economic activity which consists of the following features:
ADVERTISEMENTS:
(i) Utility is used in consumption.
(ii) Direct satisfaction of human wants takes place by consumption.
(iii) By consumption, only the form of good changes.
Consumption Function:
It implies the general relationship between income and consumption. The other name is consumption function or propensity to consume. According to Dillard, “It is a functional relationship how consumption varies when income varies.”
ADVERTISEMENTS:
Therefore C = f(y)
C→ Consumption
Y→ Current income
F → Consumption function
ADVERTISEMENTS:
According to Keynes, consumption is a direct function of income, i.e., if income increases consumption will also increase but not to the same extent. Hence, rise in income is greater than equal to rise in consumption. This is known as consumption function or propensity to consume. We can explain consumption function with the help of schedule and diagram.
Table 1: Consumption Schedule
From the above Table 1,
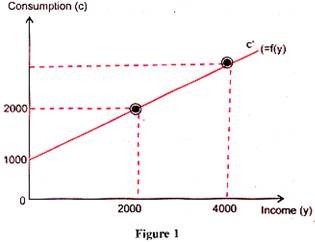
By plotting all the coordinates of income- consumption combinations and joining them we get consumption function or propensity to consume as shown in Figure 1.
In the above Figure, we get an upward rising or positively sloped consumption function with an intercept on vertical axis. At the zero level of income, there is positive consumption, as income increases, consumption will also increase but the rate of increase in income is much higher than the rate of increase in consumption. The upward rising line C shows consumption function or propensity to consume.
It is of two types as stated below:
Average Propensity to Consume (APC):
It refers to the total consumption to total income. It means the amount of expenditure that the people would like to have out of their income. Hence, according to Kurihara, “Average propensity to consume refers to total consumption by total income.”
ADVERTISEMENTS:
Therefore, APC = C/Y
The value of APC lies between zero to one.
Marginal Propensity to Consume (MPC):
It refers to the ratio of change in consumption which takes place due to change in income. It shows how much of increased income is spent on consumption and how much is saved. Hence according to Kurihara, “Marginal propensity to consume refers to change in consumption by change in income.”
Therefore, MPC = ∆C/ ∆Y
ADVERTISEMENTS:
Hence, value of MPC also lies between zero to one.
For poor people both APC and MPC have high values, but for rich their values are comparatively low.
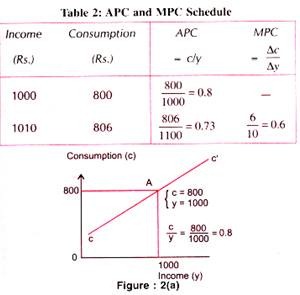
We can also diagrammatically explain APC and MPC with the help of schedule.
ADVERTISEMENTS:
In Fig. 2(b), the APC at any level of income is represented by the distance along vertical axis divided by the corresponding distance along the horizontal axis, that is, by C/Y. From the consumption function C’C’, APC can easily be ascertained. For example, at the point A; C = 800 and Y = 1000, Hence, APC = 0.8. This means 80% of an income is spent for consumption.
The MPC, represented in Fig. 2(b), is the ratio of a small change in consumption to a small change in income, it may be designated by ∆C/∆Y, where the symbol ∆ (Delta) stands for small change. According to Keynes AC is less than ∆Y. In Fig. 2(b), ∆C = 6 and ∆Y = 10, therefore MPC = (0.6) or 60 per cent. In our figure, the slope of the line C’C’ must be positive and less than one, which merely means that MPC must be positive and less than one.


