Meaning of Short-run and Long-run:
In Economics, distinction is often made between the short-run and long-run.
By short-run is meant that period of time within which a firm can vary its output by varying only the amount of variable factors, such as labour and raw material.
In the short-run period, the fixed factors such as capital equipment, management personnel, the factory buildings, etc., cannot be altered.
If, therefore, a firm wants to increase production in the short-run, it can do so only by hiring more workers or buying and using more raw materials. It cannot, in the short-run, enlarge the size of the existing plant or build a new plant of a bigger capacity. Thus, in the short-run, only variable factors can be varied, while the fixed factors remain the same.
ADVERTISEMENTS:
On the other hand, long-run is a period of time during which the quantities of all factors, variable as well as fixed, can be adjusted. Thus, in the long-run, output can be increased by increasing capital equipment or by increasing the size of the existing plant or by installing a new plant of bigger capacity.
Short-run Fixed and Variable Costs:
We have already drawn a distinction between prime (or variable) costs and supplementary (or fixed) costs. During the short period, only the prime costs relating to labour and raw materials can be varied, whereas the fixed costs remain the same. But, during the long period, even the fixed costs relating to plant and machinery, staff salaries, etc., can be varied. That is, in the long run, all costs are variable, and no costs are fixed.
Short-run Cost Curves:
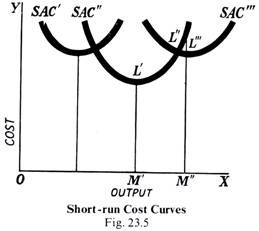
We may repeat that, in the short-run, a firm will adjust output to demand by varying the variable factors. If all the factors of production can be used in varying proportions, it means that the scale of operations of the firm can be changed. Each time, the scale of operations is changed, a new short-run cost curve will have to be drawn for the firm such as SAC’, SAC” and SAC” in the next diagram (Fig. 23.5).
To begin with, let us suppose that the firm has the short-run cost curve SAC “. ,In this case, the optimum output will be OM’. Now, if it is desired to increase the output to OM” in the short-run, it can be obtained at the average cost M”L” along the short-run cost curve SAC”, because in the short-run, the scale of operations is fixed. But, in the long run, a new and bigger plant can be built on which OM ” is the optimum output. That is, the firm has now a short-run average cost curve SAC “‘, and by increasing the scale of its operations, the firm can produce the OM” output at a cost of M “L” ‘ instead of M “L”
Thus, it will be seen that, at any scale of operations in the short-run, a firm will have regions of rising and falling costs. But, in the long-run, the firm can produce on a completely different cost curves to the left (i.e., SAC’) or right (i.e., SAC”’) of the original cost curve (i.e., SAC”). For each different scale represented by a different short-run cost curve, there will be an output where the average cost is the minimum. This is the optimum output.
Long-run Average Cost Curve:
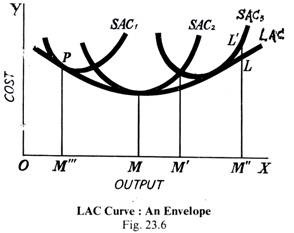
In the diagram (Fig. 23.6), SAC,, SAC,, and SAC, are the short-run cost curves corresponding to the different scales of operations. In each case, the firm in question will be producing the desired output at the lowest cost. For example, OM”’ output is produced at PM”’ in the scale of operations represented by the curve SAC OM will be produced on SAC, and so on.
It should be clearly understood that only in the long-run can the scale of operations be altered; in the short-run, it will be fixed, and the average cost of output above or below the optimum level will necessarily rise along the short-run cost curve in question, whether it be SAC,, SAC 2 and SAC3. A long-run average cost will show what the long-run cost of producing each output will be. It will be seen, in the Fig. 23.6 that the short-run average cost curve SAC, has a lower minimum point than either the curves SAC, and SAC3. The optimum output of the firm is obtained at OM.
ADVERTISEMENTS:
The long-run average cost curve LAC is a tangent to all the short-run cost curves SAC, SAC2 and SAC. The LAC curve will, therefore, be U-shaped like the short-run cost curves, but its U-shape will be less pronounced than that of the short-run cost curves. It will be flatter. That is why the long-run cost curve is called an ‘Envelope’, because it envelops all the short-run cost curves.
The cost curves, whether short-run or long-run, are U-shaped because the cost of production first starts falling as output is increased owing to the various economies of scale. But after touching the lowest point at the optimum output level, it starts rising, and goes on rising if production is continued beyond the optimum level.
This obviously makes a U-shape. But, as we have said already, the U-shape of the long-run cost curves is less pronounced. In other words, the long-run average costs are flatter than the short-run curves. The longer the period to which the curve relates, the less pronounced will be the U-shape of the cost curves. By the long period, we mean the period during which the size and organisation of the firm can be altered to meet the changed conditions.
Why is the Long-run Cost Curves Flatter? The answer can be given in terms of fixed and variable costs. We have said before that no costs are fixed in the long-run, i.e., in the long run all costs are variable. In other words, the longer the period, the fewer costs will be fixed and the more costs will be variable. That is, in the long period, the total fixed costs can be varied, whereas in the short period, this amount is fixed absolutely.
In the short-run, if output is reduced, average cost will rise because the fixed costs will work out at a higher figure. But, in the long-run, fixed costs can be reduced if the output is continued at the low level. Hence, average fixed cost will be lower in the long than in the short run.
The variable costs will not rise as sharply in the long-run as in the short-run, because in the long-run, the size of the firm can be increased to deal more economically with an increased output. Thus, LAC curves are flatter than the short-run cost curves, because, in the long-run, the average fixed cost will be lower, and variable costs will not rise to sharply as in the short period.
Why Are Long-Run Cost Curves U-Shaped?
We have explained above that the long-run cost-curves are U-Shaped. That is, as output is increased, the cost per unit falls, then it reaches a minimum after which it starts ascending so that it takes the shape of U. How do we account for this U-shape? The reason is that the cost curve falls on account of the various economies of scale. But when the firm has expanded too much, economies are changed into diseconomies and the cost curve starts rising.
Dish-Shaped Cost Curves:
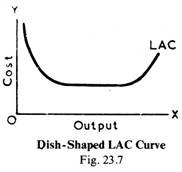
Empirical studies have further revealed that there is relatively very large flat portion or a large horizontal region in the centre of the long-run average cost curve. This means that for a considerable range of production, the long-run average cost remains the same and then it moves up at the right and making a sort of dish or saucer.
This means that the economies of scale are exhausted at some scale of operation, but diseconomies do not occur yet. But after the scale is enlarged beyond a point, dis-economies emerge and bring about a rise in the long-run average cost and thus give the curve a saucer or dish shape.
L-shaped Cost Curves:
ADVERTISEMENTS:
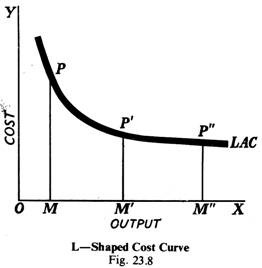
Recently some economists have put forward the view based on recent empirical studies that the cost curves take the shape of ‘L’ and not ‘U’. According to them, the shape of the long-run cost curve will be something as is given in Fig. 23.8.
In this diagram (Fig. 23.8), first OM is output produced and PM is the average cost of production including both the fixed and variable costs. When the output is expanded to OM”, the cost is P’M’, and when output is further increased to OM”, the cost is P”M” which is almost equal to P’M’.
ADVERTISEMENTS:
From this point onwards, the cost per unit is stabilized so that, whatever the output, the cost per unit remains practically the same and the LAC comes to have L-shape. This means that the cost first falls over a range of output, and then it neither rises nor falls but remains flat.
The following two reasons are given in support of the L-shape:
(i) Rapid technical progress brings about a sharp decline in unit cost up to a certain point and then stabilizes it.
(ii) With lapse of time the producer learns to produce at lower cost.


