Demand Curve of an Individual Firm under different Market Conditions!
The demand schedule (or the sales schedule) indicates how much output an individual firm can sell at each possible price. In other words, it shows the relation of the price it charges to the quantity it can sell. The nature of elasticity of such demand schedule becomes different under different market conditions.
(a) Demand for the Firm’s Output under Pure Competition:
Pure competition is characterised by a large number of small firms (or sellers) with identical products. In such a market an individual firm produces or supplies a very negligible fraction of the total market supply; accordingly it has absolutely no control over market supply and price. In other words, an individual firm cannot bring about any appreciable change in total supply through the variation in its own supply.
ADVERTISEMENTS:
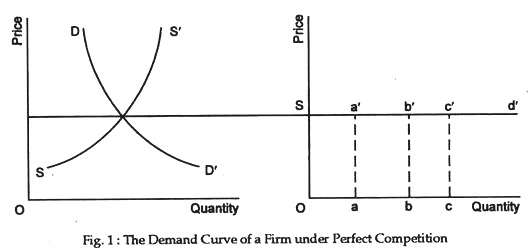
For this reason, it has to sell all the units of its own output at the same market price. A competitive firm is, indeed, a price-taker and not a price-maker. So, its demand schedule shows that at the same price the demand for its product may be infinite. Accordingly, the demand curve for its product (or the sales’ curve) will become a horizontal line as shown in Fig. 1.
In Fig. 1 (a) the market price is determined at OP because here the quantity demanded is equal to the quantity supplied (intersection of market demand curve DD’ and market supply curve SS’). As the competitive firm is to sell all the units at the same market price, i.e., OP or Od in Fig. 1(b), its demand curve becomes a horizontal line parallel to the quantity axis.
It shows that at price Od, the demand curve for its product may be Oa, Ob or Oc or infinite. The demand curve for the product of an individual firm under pure competition, dd’, is definite and stable and has an infinite elasticity (i.e., it is perfectly elastic at a particular price, i.e., the market determined price).
ADVERTISEMENTS:
(b) Demand for the Output under Monopoly:
A monopoly is a market situation of one firm or one seller. In such a market, the firm has a full control over the market supply and market price. The demand schedule of a monopolist shows that at a high price, the demand for its output is small; but at a low price, it is large. In other words, if the monopolist increases the supply, price would fall; and if he reduces the supply, price would rise. So the demand curve for the product of a monopolist has a downward slope from the left to the right as shown in Fig. 2.
In Fig. 2, dd’ is the demand curve (or the sale’s curve) for the product of a monopolist. At a price of OP1 = a’a the quantity supplied is Oa, and at price of OP2 = bb’ output is Ob and so on. This means that the price per unit decreases with the increase in the quantity offered for sale by the monopolist.
The demand curve is moving downwards from left to right, and it is relatively less elastic. This curve is also definite and stable.
ADVERTISEMENTS:
(c) Demand for the Firm’s Product under Imperfect Competition:
Monopolistic competition is one of the leading forms of imperfect competition, the other form being oligopoly. In an oligopoly market there are a few sellers, each having a considerable influence over the market supply. An oligopolist cannot find a stable and definite demand curve for product due to unpredictable reactions of rival firms’. On certain assumptions one can draw a demand curve for the product of an oligopolist, and such a demand curve becomes discontinuous and ‘kinked’.
Under monopolistic competition one can, however, find a certain and stable demand curve for the product of a firm. In such a market there are a large number of firms producing or selling differentiated products (close substitutes).
Accordingly, a monopolistic competitor can change its own sales by changing the price of the product. In such a market, if one seller reduces its own price slightly and if other sellers do not change their prices, the first seller can increase his sales considerably.
Similarly, if one seller increases its own price and if other sellers do not change their prices, the first seller’s sales would fall considerably. So, the demand for the product of the seller in such a market becomes considerably elastic.
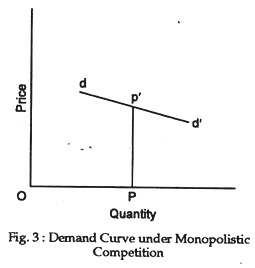
The demand curve will slope downwards, and it is highly elastic (not perfectly elastic) due to the presence of close substitute items. Such a curve is shown in Fig. 3.
In Fig. 3 dd’ is the demand curve for the product of a monopolistic competitor. The price is PP’ at the supply of OP. The figure shows that sales fall considerably, when the price is a little higher than PP’; but sales increase appreciably when price is a little lower than PP’. Such a demand curve slope downward. Its slope is less than that of a monopolist but greater than that of a firm under perfect competition and elasticity is very high (but not perfectly elastic).


