In this article we will discuss about the Ordinary Demand Curves (ODC) and Compensated Demand Curves (CDC), explained with the help of suitable diagrams.
A consumer’s ordinary demand curve for a good, also called a Marshallian demand curve, gives the quantity of the good he will buy as a function of its price.
The shape of the ordinary demand curve for a good depends upon the properties of the consumer’s utility function, viz., diminishing marginal utility (dMU) in the case of Marshallian utility theory and the diminishing marginal rate of substitution (dMRS) in the case of the indifference curve theory.
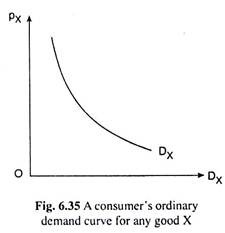
For a non-giffen good, the ordinary demand curve would be negatively sloped. The ordinary demand curve may be negatively sloped even in the case of an inferior good if the magnitude of the substitution effect of a change in the price of the good is greater than that of the income effect. A negatively sloped ordinary demand curve for any good, X, has been shown in Fig. 6.35.
ADVERTISEMENTS:
Compensated Demand Curves:
Imagine a situation in which a consumer is taxed in the case of a fall in the price of a good and subsidized in the case of a rise in its price in such a way as to leave his real income constant at the initial (pre-price change) level.
The demand curve that gives the quantity demanded of the good as a function of its price under these (compensated) conditions is called a compensated demand curve (CDC).
It may be noted here that both the imposition of a tax in the case of a price fall and the grant of a subsidy in the case of a price rise in order to keep the real income of the consumer at the initial level, are known as the compensating variation in income (CVI).
Compensated demand curves (CDCs) are of two types. First, the CDCs that are obtained on the basis of the method of compensation put forward by Slutsky. These demand curves are called the Slutsky demand curves.
According to Slutsky, after a price change, the consumer should be compensated (taxed or subsidized) in such a way that he might be able to buy also the pre-change equilibrium combination of the goods.
Second, the CDCs that are derived from the method of compensation put forward by Hicks. These curves are called Hicks demand curves. According to Hicks, the consumer should be compensated after a price change in such a way as to make him stay on the ‘original’ indifference curve on which his pre-change equilibrium point was located.
It follows from the definition of the CDCs that the Slutsky CDC is based on the Slutsky substitution effect, and the Hicks CDC is based on the Hicks substitution effect, of a price change (since the income effect in both the cases has been cancelled by the process of compensation).
ADVERTISEMENTS:
Both these CDCs are negatively sloped because of convexity-to-the origin of the consumer’s ICs, i.e., because of the diminishing MRSX, y.
When the consumer gets compensated for the price change, the resulting change in the quantity demanded of the good would be of a lesser magnitude. That is why, at any particular price, the CDC (of any variety, Slutsky or Hicks) would be less elastic or more steep than an ordinary (Marshallian) demand curve.
Again, of the Slutsky and Hicks CDCs, the latter would be less elastic than the former because Hicks’ method involves compensation of a larger magnitude, or, the Slutsky substitution effect is under-compensatory.
Derivation of the Marshallian, Slutsky and Hicks Demand Curves from the Consumer’s Indifference Curves:
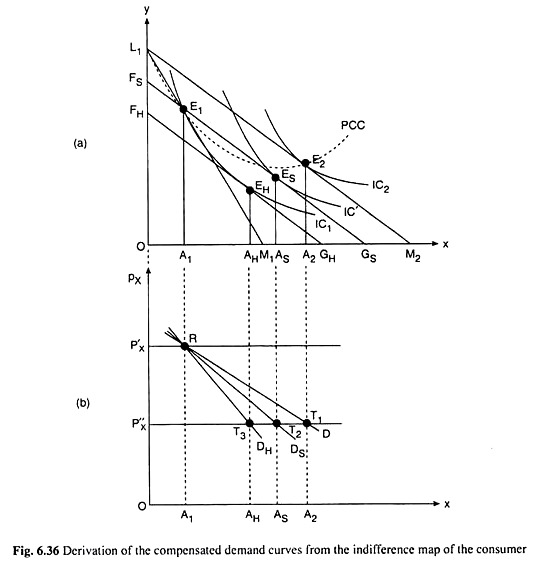
Now let’s explain the derivation of the Marshallian, Slutsky and Hicks demand curves for good X from the consumer’s ICs between the goods X and Y with the help of Fig. 6.36.
In Fig. 6.36(a), initially the budget line of the consumer is L1M1 and his equilibrium point is E1 on IC1. The budget line L1M1 is obtained for a price of good X, equal to, say, OP’x (or, px). So at the point E1, the consumer purchases OA, of X at the price = OP’x.
This price-quantity combination is represented by the point R in Fig. 6.36(b). Now suppose, px falls, ceteris paribus, from OP’x to OPx (or, px). If there is no compensation, the consumer’s budget line will now rotate from L1M1 to say, L1M2. He will now buy OA2 of X at the point E2 on IC2.
So the price-quantity combination now would be (px, OA2). This is represented by the point T1. Now join the points R and T, by a curve, the Marshallian demand curve is obtained, D. in Fig. 6.36(b).
It may be noted here that the dotted curve passing through the points L1,E1 and E2 in Fig. 6.36(a) is the price-consumption curve (PCC) for good X, and there is a one-to-one correspondence between the points on the PCC and the Marshallian demand curve.
For example, at the point E, on PCC, px is implicitly given to be p’x and demand for X is OA1, and this price- quantity combination is represented by point R on the Marshallian demand curve RD in Fig. 6.36(b).
ADVERTISEMENTS:
Similarly, at the point E2 on PCC, px is px and demand for X is OA2, and this price- quantity combination is represented by the point T, on the Marshallian demand curve. Now, the curve passing through the points like R and T, gives us the Marshallian demand curve that is derived from the PCC.
The Slutsky and Hicks compensated demand curves is obtained from the indifference curves given in Fig. 6.36(a).
In Fig. 6.36(a), the Slutsky ‘compensated’ budget line is FSGS and the consumer is in equilibrium at the point Es buying 0AS of good X at px = OP”X. This price-quantity combination is the point T2 in Fig. 6.36(b). Therefore, the curve Ds, passing through the points R and T2 is the Slutsky (compensated) demand curve.
ADVERTISEMENTS:
Lastly, the Hicks ‘compensated’ budget line is FHGH in Fig. 6.36(a). The consumer is in equilibrium at the point EH on this budget line buying OAH of good X at pX = OP”X. This price-quality combination is obtained at the point T3 in Fig. 6.36(b). The curve DH, passing through the points R and T3, is the Hicks (compensated) demand curve.
Is is seen, therefore, how the Marshallian, Slutsky and Hicks demand curves can be derived from the consumer’s indifference curves. For the sake of simplicity, draw these curves as straight lines in Fig. 6.36(b).
It is also noted (and illustrated below) that CDCs of both Hicks and Slutsky are less elastic than the ODC. One last point can be mentioned here is that Hicks and Slutsky quantity demanded would not differ substantially, if the price-change is very small. So it may lump DS and DH [Fig. 6.36(b)] together and call them simply the compensated demand curves.
Elasticities of Ordinary and Compensated Demand Curves:
From the definitions of an individual consumer’s ordinary (or Marshallian) demand curve (ODC) and a compensated demand curve (CDC) for some good, say, X, it follows that elasticity of demand (numerical coefficient, e, of price-elasticity of demand) at any price would be smaller on a CDC than on an ODC.
ADVERTISEMENTS:
This is because when px falls, the consumer would be taxed in both the cases of Hicks and Slutsky compensation, to keep his real income constant.
Therefore, the consumer’s purchase either would not have the income effect (as in the Hicks case), or, would have a very small IE (as in the under-compensatory Slutsky case), of the rise in real income due to the price fall. So if X is a normal or superior good, his purchase here would be able to rise at best to a very small extent because of the IE.
His purchase would rise mostly because of the substitution effect (SE) of a fall in the relative price of good X. On the other hand, in the Marshallian case, the consumer’s purchase of X would increase owing to both the IE and the SE of the fall in px.
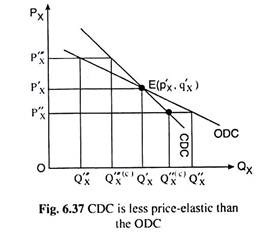
Therefore, owing to a fall in px at any price-quantity combination, the ‘compensated’ demand would rise by a smaller proportion than the Marshallian demand. That is, at the said price-quantity point, the compensated demand curve would be steeper than the Marshallian demand curve, and e would be smaller in the former case, as has happened at the price of OP’x in Fig. 6.37.
In Fig. 6.37, it is shown a CDC and an ODC. As px falls from OP’x to OP”x, demand would rise from OQ’x to OQ”x along the ODC and from OQ’x to OQ”x(c) along the CDC, the magnitude of the latter rise being smaller.
ADVERTISEMENTS:
Similarly, as px rises from OP’x to OP’’’x , the consumer would be subsidized under compensation, and the effect of a fall in real income of the consumer, i.e., IE would be eliminated or it would be very small (in the Slutsky case).
So under compensation, as px rises, the consumer’s demand would fall only because of the SE of a rise in the relative price of X. In the Marshallian case, on the other hand, as px rises, demand would fall owing to both IE and SE of the price rise.
That is, as px rises, fall in demand for X would be smaller in the ‘compensated’ case than in the Marshallian case, making the CDC steeper again than the ODC and making ‘e’ smaller in the former case and larger in the latter case.
In Fig. 6.37, as px rises from OP’x to OP”’x , compensated demand falls by a smaller amount, from OQ’x to OQ”’x(c), than the amount, from OQ’x to OQ”’x, by which the Marshallian demand falls.
From what is explained above, it is obvious that the ODC and CDC would intersect at the point of reference E(p’x, q’x). Then as px falls or rises, the compensated demand would rise or fall along a steeper curve and the ordinary or the Marshallian demand would rise or fall along a flatter curve.


