In this article we will discuss about the derivation of individual demand curve with the help of a diagram.
A demand curve has been defined as a curve that shows a relationship between the quantity-demanded of a commodity and its price assuming income, the tastes and preferences of the consumer and the prices of all other goods constant. To draw an individual demand curve the information regarding prices of a commodity at different levels and their corresponding quantities demanded is required. The price-consumption curve can provide this information.
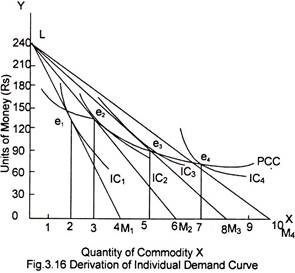
Fig. 3.16 illustrates the way in which the individual demand curve can be derived from the price consumption curve. When a demand curve is to be drawn, units of money are measured on the vertical axis while the quantity of a commodity for which demand curve is to be drawn are shown on the horizontal axis.
ADVERTISEMENTS:
Suppose a consumer has an income of Rs.240. If the price of the commodity X is Rs.60 per unit, the relevant price line will be LM1, because at this 2 units can be purchased. The consumer is in equilibrium at point el where the consumer buys 2 units of the commodity.
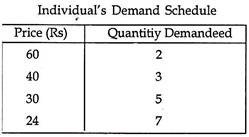
Suppose the price of X falls to Rs.40 per unit. The price line shifts to LM2. The consumer attains a new equilibrium point e2 and buys 3 units of X. As the price of X further falls, the budget line shifts to the right and new successive points of equilibrium are attained where the consumer is in equilibrium at e3 and e4 and buys 5 and 7 units of commodity X when the price is Rs.30 and Rs.24 per unit respectively.
With the above information, we draw up the following demand schedule of the consumers.
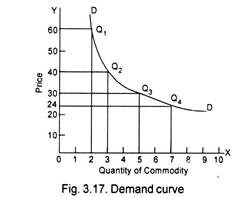
If we plot the data contained the individual consumer’s demand schedule we get points like Q1, Q2, Q3 and Q4. We can easily join these points with a continuous curve. What we get is the usual demand curve of the consumer for the commodity X. We find that the derived demand curve slopes downward from left to right just like usual demand curve.
The demand curve for normal goods will always have a negative slope denoting that the quantity bought increases as the price falls. :


