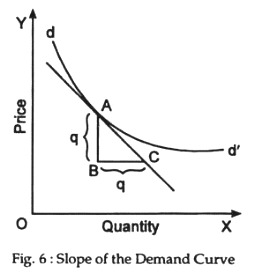
The slope of a line is a measure of its steepness. It is given by the increase in the vertical coordinates divided by the increase in the horizontal coordinates. It simply indicates how much the line rises per unit move to the right or how much it goes down as we move to the right.
The former (an upward rising curve) is said to have a positive slope while the latter (a downward sloping curve) has a negative slope. Thus, the slope of a demand curve is ∆P/∆Q. If the price falls we write -∆P/∆Q or if price rises demand falls, we write ∆P/∆Q. In either case, the slope becomes negative.
The slope of a curve refers to its steepness indicating the rate at which it moves upwards or downwards. In the language of W. J. Baumol, “The slope of a line is a measure of steepness”. The slope of a demand curve shows the ratio between the two absolute changes in price and demand (both are variables).
It can be expressed in the following way:
ADVERTISEMENTS:
The slope of the Demand Curve (at a particular point)
= Absolute Change in Price/Absolute Change in Quantity
By applying this formula, it can be said that, when at the fall of price by Re. 1 (- 1) the quantity demanded increases by 10 units (+ 10), the slope of the curve at that stage will be -1/10. It is to be noted that in the case of demand function the price decreases while the quantity increases. So, the slope of a demand curve is normally negative.
It can be illustrated with the help of the Fig. 6. In the figure, the demand curve DD’ goes downwards from left to right. The slope at the point A on the curve can be obtained by finding the slope of the tangent drawn through it. The slope at point A is the line AB divided by the line BC (i.e., the vertical axis divided by the horizontal axis). The lengths of these two lines being equal, the slope is units (i.e., 1). As the price decreases, while the quantity increases, the slope of (a) demand curve is usually negative.
It is to be noted that in the case of a straight line demand curve the slope is the same on all its points. But, it is different on different points when the demand curve is not a straight line. In all cases, however, the slope is negative. It becomes positive in the exceptional cases when the demand curve slopes upwards from left to right. In this connection, it has to be noted that the slope of the demand curve and the elasticity of demand curve are not identical except in some special cases.
While slope of a demand curve denotes absolute change (∆P/∆Q) elasticity of a demand curve is the ratio of relative change in demand to relative change in price (∆Q/Q ÷ ∆P/P). Thus, the two concepts are not identical. However, in two special situations, it is possible to calculate elasticity from slope alone, viz., the case of completely elastic demand and the case of completely inelastic demand.
If the demand curve is horizontal its slope is zero, but its elasticity is infinite. By contrast, if the demand curve is a vertical straight line its slope is infinite, but elasticity is zero. If the demand curve is a straight line its slope is constant, but elasticity falls as price drops. If the demand curve is a rectangular hyperbola, i.e., convex to the origin, its slope falls, but elasticity remains constant at 1.
Such a demand curve is called unitary elastic demand curve. Secondly, slope of a straight line demand curve never changes. But different points on it have different degrees of price elasticity ranging from infinites (α) to zero (Ep = 0).
ADVERTISEMENTS:
If, however, the curve is not a straight line the numerical value of its slope may vary as all its segments are not equally steep. In this graph, the slope is same in the sense that the line is equally steep in the vicinity of point A and in that of point B and C. In contrast, the numerical value of its elasticity at B = 1, at C less than one and at A greater than 1.
Thirdly, two separate straight line demand curves may have different slopes. In the picture, we see DD and D’D’ two separate demand curves. While DD is steeper, D’D’ is flatter. The two intersect each other at k so that when price is OP the quantity demanded is OQ in both. Now, suppose price of the commodity has fallen to OP1. Quantity demanded has increased but not equally.
It has increased more (OQ2) in D’D’ (flatter) curve than in DD (steeper) curve. Thus, we see more flatter a curve more will be its elasticity and more steeper the curve less will be its elasticity. When the demand curve is extremely steeper it becomes a perpendicular upon the horizontal axis and the value of elasticity becomes nil. As Lipsey puts it, “Measured at the point of intersection of two demand curves, the steeper curve has the lower elasticity”.
