Read this article to learn about the schedule and features of market demand.
In order to explain how market price of a commodity is determined we must have an idea of total demand for a good (say carrots) from all consumers.
To arrive at the market demand we add together the demands of all individual consumers.
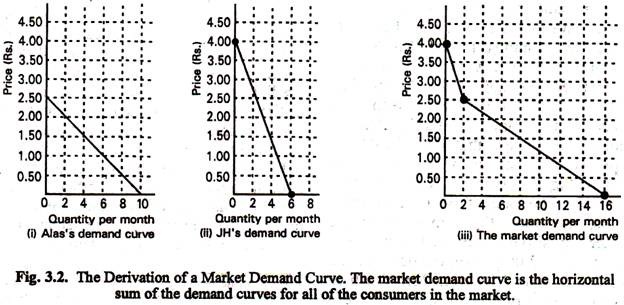
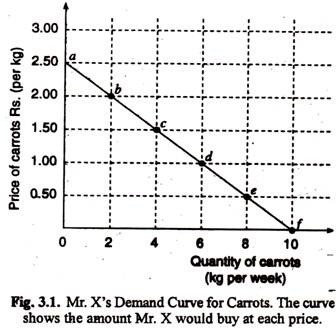
For the purpose of illustration let us take a simple case where there are only two consumers, Mr. X and Mr. Y. We have already examined the nature of the demand curve of Mr. X. We give the same information in column (ii) in Table 3.2 and Fig. 3.2 (i), adding Mr. Y’s demand schedule in column (ii) of the table, and putting his demand curve along side Mr. X’s in Fig. 3.2(ii).
ADVERTISEMENTS:
Table 3.2: Individual and Market Demand Schedules of Carrots
Market Demand Schedule:
We may first deal with the market demand schedule. This is obtained by adding the quantity demanded of Mr. X and Mr. Y at each price. We thus arrive at a total quantity demanded in column (iv). Since Mr. Y likes carrots more than Mr. X, we see that when price is between Rs. 2.50 and Rs. 3.50 per kg., only Mr. Y buys them. Since Mr. Y is then the only buyer in the market, the market demand schedules is the same as that of Mr. Y, at these high prices.
ADVERTISEMENTS:
As soon as price falls below Rs. 2.50 per kg, however, Mr. X also wants to buy carrots. The market demand at these prices is, therefore, the sum of both the consumer’s positive demands. For instance, at a price of Rs. 2.00 per kg, the demand is 2 kg. for Mr. X plus 3 kg from Mr. Y, which equals 5 kg for the two persons, when price is Re. 1,00 per kg, the market demand is 6 plus 41= 10 ⅟2 kg, and so on.
Market Demand Curve:
The market demand curve for carrots, is constructed by plotting the market demand schedules in column (iv) of Table 3.3. In fact, it is derived by adding horizontally the demand curves of the two (representative) buyers. Look at Fig. 3.3. By taking a common price on each curve, and adding the corresponding quantities, we find the total quantity demanded at each price. For example, at a price of Rs. 1.50 per kg., the two tell us that Mr. X will demand 4 kg. while Mr. Y will demand 33/4 kg. This makes a total of 73/4 kg. which is plotted as the total market demand associated with a price of Rs. 1.50 per kg.
ADVERTISEMENTS:
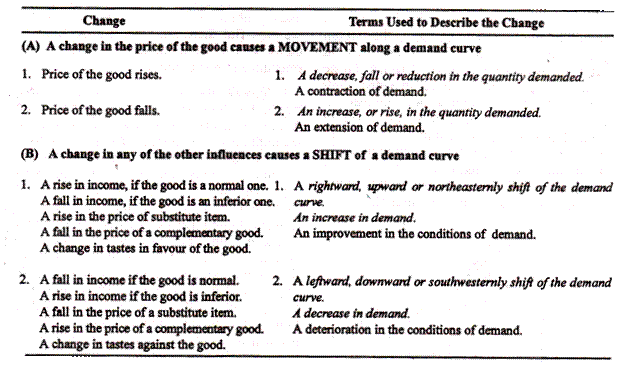
Table 3.3: Terminology of Demand Curves
Theory and Practice:
In theory we draw the market demand curve by horizontally adding up the demand curves of individual consumers. But in practice we rarely obtain market demand curves by summoning the demand curves of millions and millions of individual consumers.’ Instead, we form an idea about market demand by observing total quantities directly.
Two Features of Market Demand:
Two distinctive features of market demand are observed:
(a) Predictability:
In practice, different consumers behave differently. When the price of a commodity rises we make the prediction that its total demand will fall. But sometimes this does not happen and our prediction goes wrong. In fact it is very difficult to predict human behaviour. While some people reduce their purchase of the commodity others may increase it. So, the behaviour of one group of people may neutralise the behaviour of others. Thus, the overall behaviour of the market will remain normal. In other words, market demand is more predictable than individual demand.
(b) Entry of new consumers:
ADVERTISEMENTS:
An individual usually buys more of a commodity when its price falls. But when we consider the market for a commodity something more happens—price fall brings new consumers into the market or potential buyers become actual buyers. We saw this in the hypothetical demand curve for carrots which was drawn in Fig. 3.1. When price fall from Rs. 2, 50 to Rs. 2.00 per kg. Mr. X increased his consumption from 2 1/4 to 3 kg.
However, ‘ Mr. Y, who bought no carrots when the price was Rs. 2.50, decides to enter the market when the price falls to Rs. 2.00. They buy 2 and 3 units, respectively, at the lower price. Market demand rises, therefore, by the 3/4 of a kg. extra consumption by Mr. X plus 2 kg. new consumption by Mr. Y. The entry of Mr. Y into the market provides an additional explanation (apart from diminishing MU) of the negative slope of the demand curve (i.e. for quantity demand of carrots to increase with a fall in its price).
Special Features of Market Demand:
In the context of price determinates of demand we may now point out certain special features of market demand. These features are not usually observed in case of the demand of a single individual.
ADVERTISEMENTS:
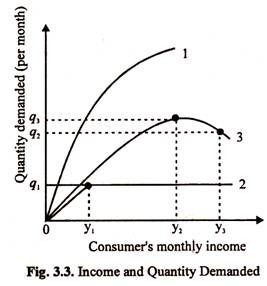
Firstly, erratic behaviour of some individuals may tend to cancel out in aggregate market demand. Thus when income increases some individuals may reduce their purchase of meat for reasons known to them. But the total demand for meat normally increases when there is a moderate but general rise in the income of the people.
Secondly, when we consider market demand for a commodity we have to take into account two other factors:
(a) The pattern of income distribution and
(b) The age and sex distribution of population.
ADVERTISEMENTS:
(a) Income distribution:
Even if a country’s national or per capita income remains constant a change in the pattern of income distribution may lead to a change in the pattern of demand. There is likely to be a shift of demand from one product to another.
If income is equitably distributed in a society most people will be able to buy the bare necessities of life such as food and clothing. If, on the other hand, income is inequitably distributed (so that few are rich and most are poor) there will be maximum demand for and production of luxury goods like costly dresses, VCRs, cars, gold jewellery, etc.
Since most people live below the poverty line there will be minimum demand for and production of necessities like bread, cheap clothing, bicycles, radio sets, etc. Thus two societies may have the same level of income. But the pattern of demand will be different due to differences in the distribution of income. If income is redistributed from the rich to the poor through tax-subsidy measures there will be a change in the pattern of demand. The demand for necessities will increase and the demand for luxuries will fall.
Let us consider another type of redistribution of income. Suppose, income taxes are raised and the additional revenue collected through it is utilised to pay extra pensions to retired government employees. There will thus be a change in pattern of income distribution from the young people to the elderly people.
As a result the demand for goods consumed by the latter (such as false teeth, hearing aids, pacemakers etc.) is likely to rise while those goods consumed by the young people such as recorded pop music, tennis rackets, etc. is likely to fall. The important point to note is that such changes may occur without any change in the overall level of income. There is only a change in the distribution of existing income.
ADVERTISEMENTS:
(b) Population distribution:
A change in the age distribution of the population is likely to change the pattern of demand. Suppose there is a fall in the death rate of people above 55. There is likely to be same type of change in the pattern of demand for goods and services which occurs due to change in the distribution of national income in favour of the old people.
A change in the sex ratio of the population is also likely to change the pattern of demand. If the number of girl babies born per thousand increases, this is likely to have some effect on the pattern of demand in the long run, but not in the short run.
Finally, migration of people from rural to urban areas may also lead to a change in the pattern of demand. The demand for rice may fall and the demand for dress materials, entertainment and transport services may increase as a result of such migration.


