Let us make an in-depth study of the meaning and types of elasticity of demand.
Meaning of Elasticity of Demand:
Elasticity of demand measures the degree of responsiveness of quantity demanded of a commodity to a change in one of the variables affecting demand (i.e., to a change in any one of the demand determinants).
The responses to change in each influencing variable is measured by a separate elasticity concept. We may start with the most commonly encountered of all elasticity, viz., and price elasticity of demand.
The law of demand states that the quantity demanded of a commodity varies inversely with its price, all other variables remaining unchanged. The law simply describes the relation between P and Q.
ADVERTISEMENTS:
However, we often want to know how much quantity demanded will change in response to a change in price. For this we require a measure of price elasticity of demand which seeks to quantify the relation between P change and Q change.
The numerical value of the elasticity coefficient tells us whether 2% fall in P will lead to 2% or 1% increase in Q. Thus price elasticity of demand measures how much the quantity demanded of a commodity changes when its price changes.
Types of Elasticity of Demand:
1. Price Elasticity of Demand:
The Law of Demand states that if the price of a commodity falls, the quantity demanded of the commodity will increase. But will it be a large or a small increase? The degree to which the quantity demanded of a commodity responds to a change in its own price is known as ‘price elasticity of demand’.
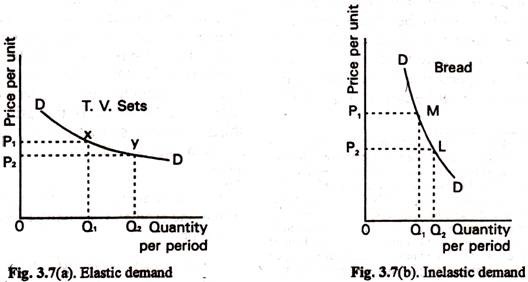
If a change in price leads to a relatively large change in quantity demand, then demand for the commodity is said to be ‘elastic’. If the change in quantity demanded is relatively small, demand is said to be ‘inelastic’. This point is illustrated in Fig. 3.7.
ADVERTISEMENTS:
In both diagrams a fall in price from OP1 to OP2 has resulted in an increase in quantity demanded from OQ1 to OQ2 In Fig. 3.7(a) the change in quantity demanded of TV sets is relatively large (demand is elastic), whereas in Fig. 3.7(b) the change in case of bread is small in relation to the price change (demand is inelastic).
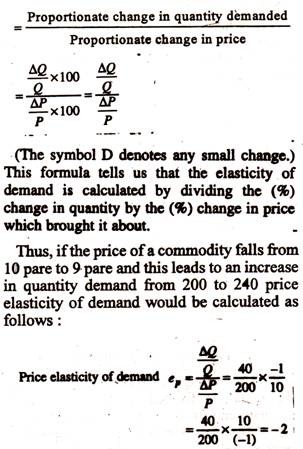
Price elasticity of demand is measured by using the formula:
Price elasticity of demand
Here ep is called the coefficient of price elasticity of demand and is always a pure number (like 1/2, 1, 2, 3, etc.) because it is the ratio of two percentage changes.
Note that ep must always be a Negative number because quantity demanded and price moves in the opposite direction to one another, i.e., if price rises, quantity demanded falls; if price falls, quantity demanded rises. So there will always be a negative figure for ep. Normally we drop the negative sign and take the absolute value of ep.
If the actual figure given by the formula is greater than 1, demand is elastic; if it is less than, demand is inelastic; if it is equal to 1, demand has unit elasticity. Demand is unitary elastic where the proportionate change in quantity demanded and price are equal.
Different Types of Price-Elasticity:
It is possible to distinguish among five types of price elasticity of demand:
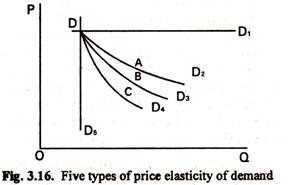
1. When a small fall in price leads to infinitely large purchases, demand is said to be infinitely elastic or perfectly elastic (Ep → ∞). The demand curve in this case is a straight line parallel, to the horizontal-axis (DD1 in Fig. 3.16).
2. When a small fall in the price leads to a large but a finite increase of purchases, demand is called elastic (Ep < ∞ and > 1). The demand curve has a smooth slope (DD2 in Fig. 3.16). On DD, at A, Ep > 1.
3. When a change of price causes an exactly proportional change of demand, the elasticity of demand is Unity (E =1). On DD3 in Fig. 3.16, Ep = 1 at point B.
ADVERTISEMENTS:
4. When a fall of price reduces total outlay but not to zero, demand is inelastic (Ep < 1 and > 0). The demand curve in this case has a steep slope (DD4 in Fig. 3.16). On DD4 at C, Ep < 1.
5. When a change of price causes no change in the amount purchased, demand is said to be infinitely inelastic or perfectly inelastic (Ep = 0). The demand curve in this case is a straight line parallel to the vertical-axis (DD5 in Fig. 3.16).
The Total Outlay Method:
A simple method of determining price elasticity is by reference to the total revenue derived by firms from the sale of the commodity or the total outlay of consumers on a product. If the price of the commodity falls, quantity demanded will increase. But what will happen to total outlay? What happens to total outlay will depend upon the extent to which quantity demanded increases. If quantity demanded increases a great deal— to more than offset the fall in price—total outlay will increase and demand is said to be elastic.
ADVERTISEMENTS:
Thus in Fig. 3.7(a) when price falls from OP1 to OP2 total outlay increases from OP1 XQ1 to OP2 YQ2 If, however, quantity demanded increases only slightly, i.e., not enough to offset the fall in price, total outlay will fall and demand is said to be inelastic. In Fig. 3.7(b) total revenue falls from OP1MQ1 to OP2LQ2. If quantity demanded increases only enough to offset the fall in price, total outlay will be unchanged and demand is said to have unit elasticity. We can adopt same approach for price rise.
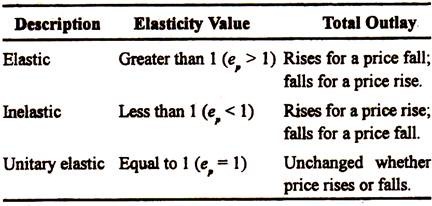
The three main points to be noted here are listed in Table 3.4.
Table 3.4: Total Outlay with Different Elasticities of Demand
ADVERTISEMENTS:
Value of Price Elasticity on a Straight Line Demand Curve:
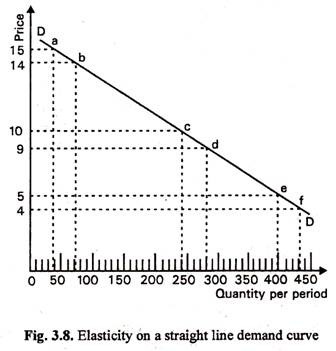
It is important to note in this context that the value for elasticity will usually be different at every point on a demand curve. This must be the case because the formula makes use of the initial price and quantity as well as the changes in each. As we take different points on the demand curve, we have different starting points (or initial values) for price and quantity. So the value for elasticity will differ. This may be illustrated with reference to Fig. 3.8.
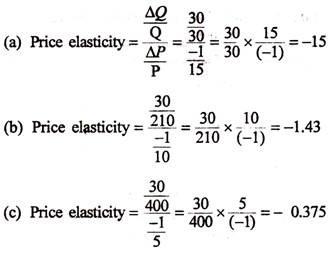
Using the figures from the demand curve given in Fig. 3.8 we shall measure elasticity with regard to: (a) a fall in price from 15p to 14p, (b) a fall in price from 10p to 9p and (c) a fall in price from 5p to 4p.
We see that although AQ and AP are the same in all three cases, the value for elasticity is different in each case. With a downward- sloping straight-line demand curve, price elasticity falls as one moves down the curve from left to right.
ADVERTISEMENTS:
This explains why one should refer to elasticity at a particular point on a demand curve rather than to the elasticity of a demand curve. There are exceptions to this, i.e., situations where elasticity is the same at all points on the curve.
Three such exceptions are the following:
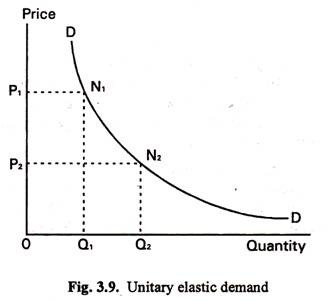
(1) Where the demand curve is the rectangular hyperbola, elasticity of demand is unity at all points on the curve. This is illustrated in Fig. 3.9.
With a rectangular hyperbola, the area of the rectangle formed by the abscisa, the ordinate and the axes (i.e. rectangle such as OP1N1Q1 in Fig. 3.9) is the same for any point on the curve. Therefore, in Fig. 3.9 the area of OP1N1Q1 is equal to that of OP2N2Q2.
But the areas of these rectangles give the total revenue from the sale of the product at prices OP1 and OP2, respectively. So we see that if price falls from OP1 to OP2 total outlay is unchanged. We saw earlier that this means that demand has unit elasticity. The same would be true if we took any other points on the curve.
ADVERTISEMENTS:
Thus, with a rectangular hyperbola, elasticity of demand is equal to unity at all points on the curve.
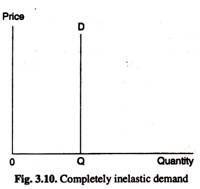
(2) Where elasticity of demand is zero.
In Fig. 3.10 the quantity OQ will be demanded regardless of what the price is. Thus the quantity demanded does not change as price changes—elasticity of demand is zero. Demand here is said to be perfectly inelastic.
(3) Where elasticity of demand is infinity.
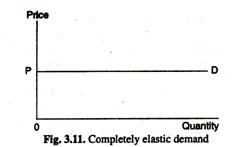
In Fig. 3.11 consumers will buy all they can at the price OP, but if the price rises even slightly above this they will buy none at all. Thus, at price, OP elasticity of demand is equal to infinity. Demand here is said to be perfectly elastic.
In the last two cases it is possible to calculate elasticity from slope alone. In Fig. 3.10 the slope of the demand curve is infinite but elasticity is zero throughout. In Fig. 3.11 the slope of the demand curve is zero but elasticity is infinite.
2. Arc Elasticity of Demand:
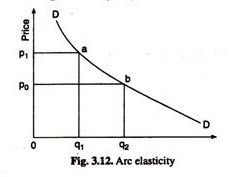
There are two measures of price elasticity of demand arc elasticity and point elasticity. Arc elasticity concept is easy to grasp. Here the elasticity is measured over an arc of the demand curve. Suppose the demand curve for a commodity is as shown in Fig. 3.12. Let initially at a price p0 demand is q0. Price then rises to P1, when demand also changes to q1.
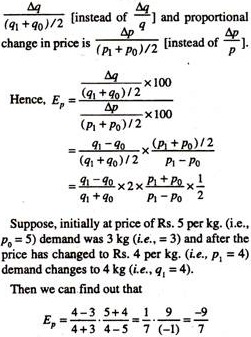
Here, easily we can define Δq = qx– q0 and Δp = p1 – p0. But what about q and p since each of p and q has two values (initial value and the changed value)? Should we use the initial values of p and q or the new values? The ready-made solution is to use some average of both the values, i.e., we should take
q = q0 + q1/2 and p = p0 + p1 / 2.
Thus proportional change in quantity
ADVERTISEMENTS:
The arc elasticity concept is useful since in reality price and quantity changes occur in jumps, i.e., there are gaps between any two values of both price and quantity demanded.
This follows from our earlier analysis where we argued that empirically we find some definite values of price arid corresponding amounts of demand. Not that we get every conceivable configuration of price and demand. [Furthermore, this concept yields only rough or approximate measures, since we here approximate the curvilinear stretch (as the stretch form A to B in Fig. 3.12) between the two points on the demand curve by a straight line. This is implied in the measure.]
3. Point Elasticity of Demand:
In contrast to the concept of arc elasticity, point elasticity refers to measuring elasticity of demand at a particular point on the demand curve. Actually it is the limiting case of arc elasticity, since when changes in the price (and consequently changes in quantity demanded) are too small, the arc converges to a point. And then the effective expression of elasticity measure becomes
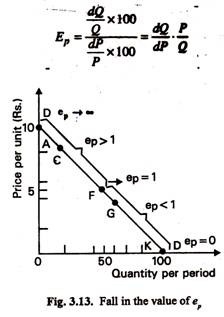
If we are to measure elasticity at a particular price (which corresponds to a point on a demand curve) we have to use the graphical (geometrical) method. If we consider any point on the demand curve then the value of ep at the point is equal to the length of the demand curve below that point, divided by the length of the demand curve above it. This point is illustrated in Fig. 3.12. At point C the value would be Ep = 8/2 = 4, whereas at point F the value would be ep = 5/5 = 1, and at G, it would be ep = 4/6 = 2/3.
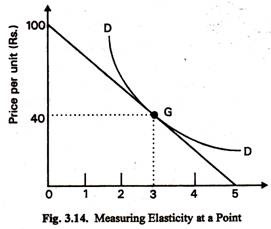
The same geometrical method may be used for non-linear demand curve, as is presented in Fig. 3.13. To calculate elasticity at a particular price, say Rs. 40 per unit, we have to draw a tangent to the curve at the point we wish to measure ep. Suppose we want to calculate ep at point G of the demand curve, it is now necessary to draw a tangent touching both of the axes. The value of e can then be calculated on the length of the tangent below this point divided by the length of the tangent above—in this case ep—2/3. This is the value of point elasticity rather than arc elasticity.
Detailed Discussion of Point Elasticity:
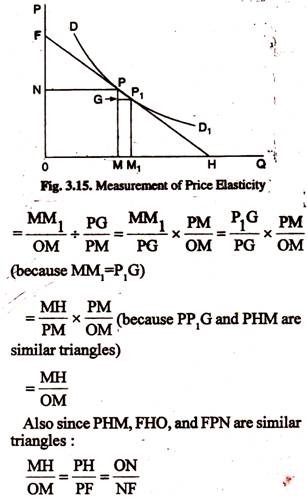
Let P and P, be two points so close together on the demand curve (DD1) that PP1 is a straight line. Obviously, in this, case the change of price and of demand are very small quantities. PP1 can be taken to be the tangent to the demand curve at P. At point P,
Elasticity of Demand = proportionate change in quantity/proportionate change in price
Numerical value of the elasticity:
Thus, to find the elasticity of any point on the demand curve, draw the tangent to the demand curve at that point. Any one of the above ratios will give the numerical value of the elasticity.
Slope of the Demand Curve:
In this context we may draw a distinction between the slope of the demand curve and its elasticity. We may note that the slope of the demand curve is ∆P/∆Q (which is always negative). It is because P change and Q are always in the opposite direction on a downward sloping demand curve.
Slope measures absolute change or it is the ratio of two absolute changes (i.e., absolute change in price and the absolute change in quantity). But elasticity measures percentage change. The reciprocal of the slope of the demand curve, i.e., ΔQ/ΔP has to be multiplied by the original price-quantity ratio (P/Q) to find out the value of the elasticity coefficient.
The slope of a curve is a geometrical concept. The slope of a curve is its steepness. It is measured by finding out the tangent to the curve at a point. In Fig. 3.15, at point P, Slope of the curve = Slope of the tangent
= PM/ MH = FO/OH.
When a curve goes downward from left to right (as it is usually in the demand curve) the slope is negative. The reason is that in a demand curve when price increases quantity diminishes. In cases where the curve goes upward from left to right the slope is positive.
The slope of a demand curve usually varies from one point to another. If the demand curve is a straight line like DD1 in Fig. 3.16, it has the same negative slope at all points.
Different Types of Price-Elasticity:
It is possible to distinguish among five types of price elasticity of demand:
1. When a small fall in price leads to infinitely large purchases, demand is said to be infinitely elastic or perfectly elastic (Ep→∞). The demand curve in this case is a straight line parallel to the horizontal-axis (DD. in Fig. 3.16).
2. When a small fall in the price leads to a large but a finite increase of purchases, demand is called elastic (E < ∞ and > 1). The demand curve has a smooth slope (DD2 in Fig. 3.16). On DD2 at A, Ep > 1.
3. When a change of price causes an exactly proportional change of demand, the elasticity of demand is Unity (Ep = 1). On DD3 in Fig. 3.16, Ep = 1 at point B.
4. When a fall of price reduces total outlay but not to zero, demand is inelastic (Ep < 1 and > 0). The demand curve in this case has a steep slope (DD4 in Fig. 3.16). On DD4 at C, Ep < 1.
5. When a change of price causes no change in the amount purchased, demand is said to be infinitely inelastic or perfectly inelastic (Ep = 0). The demand curve in this case is a straight line parallel to the vertical-axis (DD5 in Fig. 3.16).
Comment: In real life we meet only with cases 2, 3 and 4. The first case of weak percentage response, e.g., rice and wheat (Case 4). This is inelastic demand. The next case is great percentage response, e.g., luxury goods (Case 2). This is elastic demand. The intermediate case is where. there is unitary of demand (Case 3).
