In this article we will discuss about Measuring Elasticity of Demand from the Price Consumption Curve.
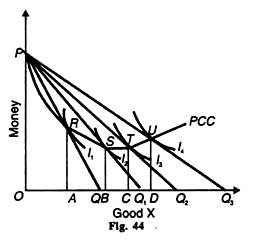
It is possible to know the elasticity of demand from the slope of the price-consumption curve PCC drawn in Figure 44 in terms of Marshall’s Total Outlay Method.
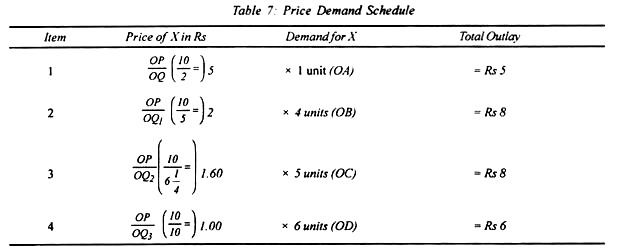
If the price-consumption curve slopes downward, the demand for X good is elastic as shown by the slope of the PCC curve from point R to S. As the price of X falls from ОР/OQ to OP/OQ1 the total expenditure on good X increases because more of X is bought. This is clear for the price-demand schedule for good X shown in the Table 7.
ADVERTISEMENTS:
When the price of X falls from Rs.5 to Rs.2, the total expenditure increases from Rs.5 to Rs.8, as is clear from items 1 and 2 in Table 7. Thus the demand for good X is elastic in the portion RS on the PCC curve. The segment ST of the PCC curve which is horizontal represents unitary elasticity. When the price of X falls from OP/OQ1 to OP/OQ2 same i.e. Rs 8 as per items 2 and 3 of Table 7. The elasticity of demand is unity.
When the price-consumption curve slopes upward, it shows elasticity less than unity. As the price of X falls from OP/OQ2 to OP/OQ3 the consumer moves from point T to U on the price-consumption curve PCC. His total expenditure on good X falls from Rs 8 to Rs 6 with a fall in its price, as revealed by items 3 and 4 of Table 7.

