Let us learn about the relation between TR, AR, MR and Elasticity of Demand.
Being a price-maker, a monopolist can select or set the price of his own product. The demand curve faced by a monopoly firm is the industry (or market) demand curve as there is only one firm in the industry. Thus the demand curve (or the AR curve) of a monopoly seller is a downward sloping curve. Its corresponding MR curve is also downward sloping and lies below AR curve (i.e., AR > MR).
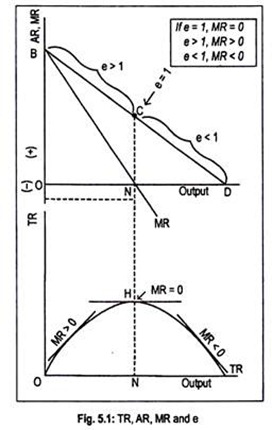
As the monopolist desires to increase output, TR may increase, and may decrease after reaching a maximum. Whether TR will increase or decrease depends on whether MR is positive or zero or negative, which, in turn, depends on whether demand is elastic or unitary elastic or inelastic. In Fig. 5.1, we have shown such relationship between TR, AR, MR and elasticity of demand (e).
We have already shown the following relationship among AR, MR and e as:
ADVERTISEMENTS:
MR = AR (1 – 1/e)
In this figure, TR curve has been drawn in the bottom part, while AR and MR curves have been drawn in the upper panel.
As the monopolist expands output, TR rises, reaches maximum at point H (corresponding to output ON) and, thereafter, TR declines. AR curve or BD curve has been drawn as a negatively sloped straight line. Elasticity of demand varies from point to point on this demand curve.
ADVERTISEMENTS:
At the mid-point (point C) of BD or AR curve, coefficient of elasticity of demand is unity (e = 1). The corresponding MR is zero. Thus, a monopolist earns maximum TR by producing and selling ON units of output. In other words, at output ON, TR is maximum, MR is zero and elasticity of demand is unity.
Below ON output level, TR increases as output expands. Consider any point to the left of point C on the AR curve where e > 1. Note that at this output level, MR is positive. Thus, when TR rises, MR > 0 and e > 1.
Beyond ON output, since TR declines as output expands, elasticity declines. Elasticity of demand becomes less than one to the right of point C on the AR curve. Consequently, MR becomes negative. Thus, when TR declines, MR < 0 and e < 1.
Obviously, a producer should produce in that region where MR is positive.
