The basic tool of Hicks-Allen ordinal utility analysis of demand is the indifference curve which represents all those combinations of goods which give same satisfaction to the consumer.
Since all the combinations on an indifference curve give equal satisfaction to the consumer he will be indifferent between them, that is, it will not matter to him which one he gets.
In other words, all combinations of two goods lying on a consumer’s indifference curve are equally desirable to or equally preferred by him. To understand indifference curves, it is better to start with indifference schedules.
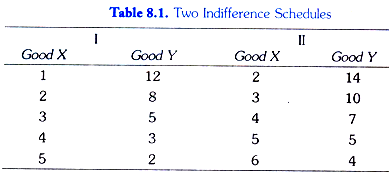
In Table 8.1, two indifference schedules are given. In each schedule the amounts of goods X and Yin each combination are so much that the consumer is indifferent among the combinations in each schedule. In schedule 1, the consumer has to start with 1 unit of X and 12 units of Y.
ADVERTISEMENTS:
Now, the consumer is asked to tell how much of good Y he will be willing to give up for the gain of an additional unit of X so that his level of satisfaction remains the same If the gain of one unit of X compensates him fully for the loss of 4 units of Y, then the next combination of 2 units of X and 8 units of Y (2X + 8Y) will give him as much satisfaction as the initial combination (1X + 12 Y).
Similarly, by asking the consumer further how much of Y he will be prepared to forgo for successive increments in his stock of X so that his level of satisfaction remains unaltered, we get combinations 3X + 5Y, 4X + 3 Y and 5X + 2Y, each of-which provides him same satisfaction as combination 1X + 12Yor 2X + Since his satisfaction is the same whichever combination of goods in the schedule is offered to him he will be indifferent among the combinations of two goods included in the schedule.
In schedule II, the consumer has initially 2 units of X and 14 units of Y. By asking the consumer how much of Y he will be prepared to abandon for the successive additions of X in his stock so that his satisfaction remains equal to what he derives from the initial combination (2X+14Y) we get combinations 3X+ 10Y, 4X + 7Y, 5X+ 5Y and 6X+ 47. Thus, each of the combinations in schedule II will be equally desirable to the consumer and he will be indifferent among them.
ADVERTISEMENTS:
But it should be borne in mind that the consumer will prefer any combination in schedule II to any combination in schedule I. That is, any combination in schedule II will give him more satisfaction than any combination in schedule I. This is because it is assumed that more of a commodity is preferable to less of it (in other words, the greater quantity of a good gives an individual more satisfaction than the smaller quantity of it), the quantities of other goods with him remaining the same.
Initial combination in schedule II contains more of both the goods than the initial combination in schedule I, therefore the former will give greater satisfaction to the consumer than the latter. Now, since each of the other combinations in indifference schedule II provides the consumer same satisfaction as the initial combination (2X + 14 Y) of this schedule and also each of other combinations in indifference schedule I gives the same satisfaction as the initial combination (1X + 12 V), any combination of the schedule II will be preferred to (will yield greater satisfaction) than any combination of schedule I.
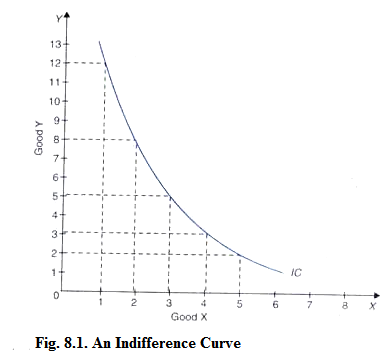
Now we can convert the indifference schedules into indifference curves by plotting the various combinations on a graph paper. In Fig. 8.1 an indifference curve IC is drawn by plotting the various combinations of the indifference schedule I. The quantity of good X is measured on the horizontal axis, and the quantity of the good Y is measured on the vertical axis.
As in an indifference schedule, combinations lying on an indifference curve will also be equally desirable to the consumer, that is, will give him the same satisfaction. The smoothness and continuity of an indifference curve mean that goods in question are assumed to be perfectly divisible. If the indifference schedule II is also converted into indifference curve, this will lie above the indifference curve IC.
Any combination on a higher indifference curve will be preferred to any combination on a lower indifference curve. It is thus clear that the indifference curve lying above and to the right of an indifference curve will indicate a higher level of satisfaction.
It may be noted that while an indifference curve shows all those combinations of two goods which provide equal satisfaction to the consumer, it does not indicate exactly how much satisfaction is derived by the consumer from those combinations. This is because the concept of ordinal utility does not involve the quantitative measurability of utility. Therefore, no attempt is made to label an indifference curve by the amount of satisfaction it represents.
Indifference Map:
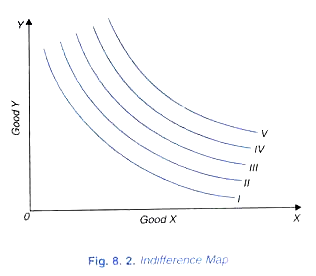
A complete description of consumer’s tastes and preferences can be represented by an indifference map which consists of a set of indifference curves. Because the field in a two- dimensional diagram contains an infinite number of points, each representing a combination of goods X and Y, there will be an infinite number of the indifference curves each passing through combinations of goods that are equally desirable to the consumer. In Fig.8.2 an indifference map of a consumer is shown which consists of five indifference curves. The consumer regards all combinations on the indifference curve I as giving him equal satisfaction.
Similarly all the combinations lying on indifference curve II provide the same satisfaction but the level of satisfaction on indifference curve II will be greater than the level of satisfaction on indifference curve I Likewise, all higher indifference curves, III, IV and V represent progressively higher and higher levels satisfaction. It is important to remember that while the consumer will prefer any combination on a higher indifference curve to any combination on a lower indifference curve, but by bow much he prefers one combination to another cannot be said.
In other words, a higher indifference curve represents a higher level of satisfaction than a lower indifference curve but by “how much higher” cannot be indicated. This is because the indifference curve system is based upon the concept of ordinal utility according to which the consumer is able to state only the ‘qualitative differences in his various levels of satisfaction.
It is not possible for the consumer to specify ‘quantitative differences in his various levels of satisfaction (i.e., by how much more or by how much less cannot be stated by him). Therefore, in an indifference map successively higher indifference curves can be denoted by any ascending series, 1,3,7, 9…; or 1, 4, 6, 8, 13…; or 1 2 5 8 10…; etc., the magnitude of these various numbers and the quantitative differences among them having no relevance. It is more usual to label the indifference curves by ordinal numbers as I, II, III, IV, V as is done in Fig. 8.2.
An indifference map of a consumer represents, his tastes and preferences for the two goods and his preferences between different combinations of them. In other words an indifference map portrays consumer’s scale of preferences. Scale of preferences of indifference curve analysis replaces Marshall’s utility schedule. So long as consumer’s tastes and preferences remain unchanged, the whole indifference map will remain the same.
ADVERTISEMENTS:
If the consumer s tastes and preferences undergo a change, then a new indifference map corresponding to new tastes and preferences will have to be drawn. If, for instance good Y is eggs and good X is bread, and if the doctor advises our consumer to take more of eggs to overcome some diseases, the shapes of all his indifference curves will change and his indifference map will have to be redrawn. Since the doctor’s advice will intensify our consumer’s desire for eggs, now a smaller quantity of eggs than before will be given up by him for a given increment in bread.


