In this article we will discuss about the relation between TR, AR and MR with the help of Tables 3.1 and 3.2.
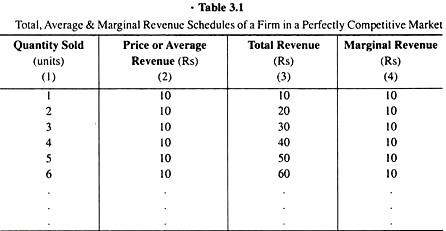
In Table 3.1, presented TR, AR and MR schedules (hypothetical) of a competitive firm.
Remember that, under perfect competition, the firm can sell more or less any quantity of its product at the price determined in the market, and, therefore, as seen in MR = p (= AR) = constant.. (3.9), the firm’s AR and MR would be equal at any quantity of output sold.
From Table 3.1 it is obtained that at any q, the price of the product is Rs 10 = constant, which is also equal to the firm’s AR = MR (at any q). Since, here, p = Rs 10 = constant, the firm’s total revenue has increased at the constant rate of Rs 10, as its quantity sold (q) has increased.
ADVERTISEMENTS:
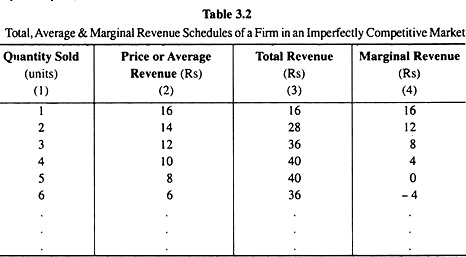
In Table 3.1, columns (1) and (2) give the AR function of the firm, columns (1) and (4) give us the MR function and columns (1) and (3) give us the TR function. The graphs of these functions would be, respectively, the AR, MR and TR curves of a perfectly competitive firm In Table 3.2, have presented the TR, AR and MR schedules (hypothetical) of an imperfectly competitive firm.
Remember that, under imperfect competition, the firm would have to reduce its price if it wants to sell more and, that is why, both its AR and MR would be diminishing as q increases, and in MR = p (= AR) = constant.. (3.9), have obtained that if q > 0 [in the discrete analysis, if q > 1] MR < AR.
In Table 3.2 that as q increases, the firm’s AR and MR both decrease, and its TR increases at a diminishing rate, since the MR itself is the rate of change of TR, MR = d/dq (TR)[eq. (3.7)]. At q = 5 it is obtained that, the firm’s falling MR, i.e., the falling rate of change of its TR, has become zero, i.e., when q has increased from 4 units to 5 units, the firm’s TR has not at all increased.
ADVERTISEMENTS:
Again, at q = 6, MR or the rate of change of TR has decreased further and has become negative, i.e., as q increases from 5 units to 6 units, TR, instead of increasing, has actually decreased. The cause of MR becoming zero or negative at some q is that p diminishes in the imperfectly competitive market as q increases. Note here that at MR = 0, TR has been the maximum.
In Table 3.2, the columns (1) and (2) constitute the AR function of the imperfectly competitive firm, the columns (1) and (4) constitute its MR function, and columns (1) and (3) its TR function. The graphs of these functions themselves would be, respectively, the AR, MR and TR curves of such a firm.

