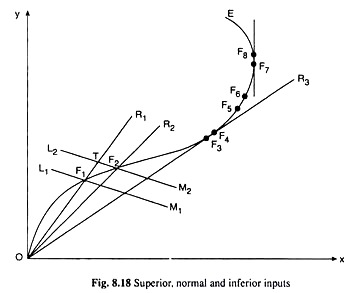
We shall assume here that the firm uses only two inputs, X and Y, to produce an output. The expansion path of the firm is given by the ‘path’ OE in Fig. 8.18. Let us note that this curve is positively sloped up to a certain point (F7) and then its slope becomes negative.
We shall see that the nature of the expenditure-elasticity of an input, say X, would be different over different stretches of the expansion path. Let us first note that at any point on the expansion path, the input-ratio y/x is given by the slope of the ray from the origin to that point. For example, at the point F1 on the EP, the ratio is given by the slope of the ray OF1 or OR1.
Now, consequent upon the successive increases in its expenditure, as the firm moves over the positively sloped and concave downwards stretch of the EP between the points O and F3 (where the ray from the origin has touched the EP), its use of both X and Y increases but the y/x ratio falls and the ray becomes flatter.
Over this stretch, the expenditure-elasticity of input X would be greater than 1 and X would be a superior input. Let us prove this point.
Let us suppose that the firm is at the point F, on the EP and on the iso-cost line (ICL) L1M1. The ray through F1 is OR1. Let us also suppose that firm increases the expenditure (C) on the two inputs, their prices remaining the same, and the ICL has a parallel rightward shift from L1M1, to L2M2.
As a result, the firm’s equilibrium point would move along the EP from the point F1 on L1M1 to F2 on L2M2. In order to obtain ηx, we have to compare between the resulting percentage increase in expenditure and that in the use of input X. We may do this in the following way.
Owing to the increase in C, if the firm moved from the point F1 on L1M1 to the point T on L2M2 along the ray OR1, then since the input-ratio would remain the same, firm’s x and y would rise in the same proportion, and the prices remaining the same, C would also increase by the same proportion. But the firm has actually moved from the point F1 to F2 on L2M2 along its EP.
Since the slope of the ray through F2 is smaller than that through F1, the y/x ratio has now fallen, i.e., actually x has increased by a larger percentage, and, therefore, it has increased by a larger percentage than C also. In other words, the percentage increase in x has been larger than the percentage increase in C, giving us that ηx at the point F1 is greater than 1 and input X is a superior input.
ADVERTISEMENTS:
Let us now come to the point F3 on the expansion path OE, where the ray OR3 from the origin has become a tangent to the EP. At this point, if C rises, let us suppose, by a very small amount, the firm would move along the EP from F3 to a very close point F4.
Actually, the rise in C would have to be so small, and the points F3 and F4 would have to be so close that the rays from the origin to the points F3 and F4 would be identical, In this case, if we apply the Same type of analysis as we have done above, we would find that the percentage increase in C and the percentage increase in x would be the same giving us ηx to be equal to 1.
Therefore, at the point F3, the input X would be a normal input.
Let us now come to the upward sloping and convex downwards stretch of the EP in Fig. 8.18, between the points F3 and F7. At any point over this stretch like F5, let US suppose, C rises and the firm moves from F5 to F6 along its EP.
ADVERTISEMENTS:
In this case, the ray through F6 would be steeper than that through F5. By the same logic as we have applied above, we would find that at the point F5, percentage rise in x would be smaller than the percentage rise in C. This would give us that ηx would be less than 1 but positive. So the input X here would also be a normal input.
Now at the point F7 on the EP in Fig. 18.8, the tangent to the curve has been vertical. This would give us that as C rises by a very small amount, a very small movement along the EP from F7 to F8 would keep x the same. So, in this case, although C has increased, the change in x is zero giving us ηx = 0. Here, at the point F7 also, input X would be a normal input.
Lastly, the stretch of the EP in Fig. 8.18, beyond the point F7 is backward bending. Over this stretch at any point, if C increases, x would decrease, and we would get a negative ηx. That is, over this backward bending stretch of the EP, input X would be an inferior input.
We have seen, therefore, the following, along the expansion path like OE in Fig. 8.18:
(i) Over the concave downwards stretch between the points 0 and F3, ηx > 1 and input X would be a superior input.
(ii) Over the convex downwards stretch from the point F3 to the point F7, 0 ≤ ηx ≤ 1 and input X would be a normal input.
(iii) Over the backward bending stretch beyond the point F7, ηx < 0 and input X would be an inferior input. Here, at any point, the slope of the expansion path in negative.
