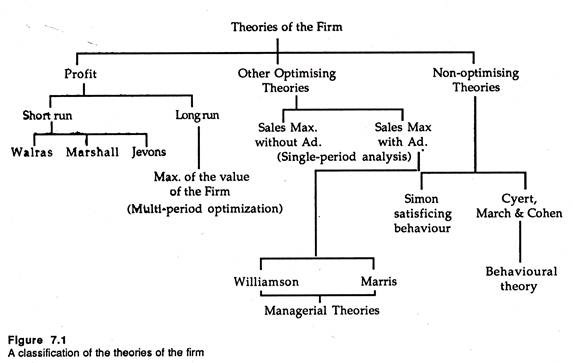
The following points highlight the three main theories of firm. The theories are: 1. Profit-Maximizing Theories 2. Other Optimizing Theories 3. Non-Optimizing Theories.
Theory # 1. Profit-Maximizing Theories:
The traditional objective of the business firm is profit-maximization. The theories based on the objective of profit maximization are derived from the neo-classical marginalist theory of the firm.
ADVERTISEMENTS:
The common concern of such theories is to predict optimal price and output decisions which will maximize profit of the firm. We have already discussed these decisions in relation to the different forms of competitive structure from pure (perfect) competition at one end of the spectrum to monopoly at the other.
In essence the theories based on the profit- maximization goal suggests that firm seeks to make the difference between total revenue (or sales receipt) and total cost (outgo) as large as possible.
However, one pertinent question here is: does the firm attempt to maximize long term profit or short- term profit? The basic valuation model of the firm is based on the fundamental assumption that the firm seeks to maximize its long-term profit.
ADVERTISEMENTS:
According to this model, a firm seeks to maximize its discounted present value. To arrive at an estimate of discounted present value of the firm we reduce future profits by a discount factor or weight, to make future profits comparable with present profits. Let PVf refer to the present value of the firm and π1, π2,. . . . . , πn refer to profits in the next n time periods. Therefore, we can express PVf as:
PVƒ = W1 π1 + W2 π2 + … + Wn πn
where W1, W2,……. Wn are the weights we assign to future profits to be able to make inter-temporal comparisons of money sums. One complication that arises in this context is that the choice of weights largely depends on the firm’s rate of time preference, i.e., how the firm values present profits compared to future profits.
The short-run profit maximization hypothesis is based on the famous marginalist rule which we have explained. A firm maximizes profit when by producing and selling one more unit it adds as much as to revenue as to cost.
ADVERTISEMENTS:
The addition to revenue is called marginal revenue and the additional cost marginal cost. Thus, a firm maximizes profit when MR = MC. If this condition holds and if the MC curve intersects the MR curve from below and not from above, total profit (i.e., π = TR – TC) will be maximum.
However, if the periods are dependent (i.e., if current decisions or actions affect future decisions of the firm) short-run profit maximization will lead to incorrect decisions because of lack of provision for the future. For instance, the firm could generate higher profits now by not replacing capital goods, delaying payment on due accounts etc. all of which will surely reduce the size of future profits.
By contrast, if profits are independent in different time periods, long-run profit maximization would simply amount to maximizing the series of short-term profits. But such a situation does not prevail in the real world. All firms which have made huge capital investments will observe that profits in different time periods are interdependent.
There is a trade-off between short-term and long-term profit. If more (or a steady flow of) profit is derived in the long run, adequate provision has to be made for depreciation (capital consumption) and short-term dues are to be cleared. If more profit is to be made in the short run, some long-term profit has to be sacrificed.
With the above complications in mind we may now briefly discuss the traditional theory. The essence of the traditional approach is to compare cost and revenue of a firm at different levels of output and to select the one which maximizes the absolute differences between the two.
The short-run profit maximization hypothesis is illustrated in Figure 7.1. The TC and TR are shown on the vertical axis and output on the horizontal axis. The firm produces a level of output OQ* for which TR = OR* and TC = OJ and the gap between the two (R*J) is maximum. Thus Q* is indeed the profit-maximizing level of output.
The slope of the TR curve measures MR and the slope of the TC curve measures MC. At points A and B, two curves have the same slope. Thus at OQ*, MR = MC. This can be verified by passing two tangents — one through A and the other through B and ensuring that they are parallel.
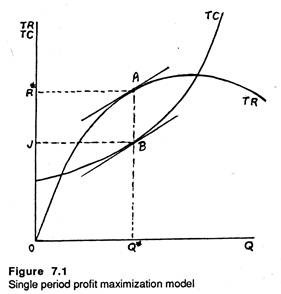
Subtracting the TC curve from the TR curve we derive the total net profit curve π which cuts the horizontal axis where TR = TC. We reach the top of the profit hill when Q* is the level of output that is produced and sold.
ADVERTISEMENTS:
In Figure 7.1 the firm produces OQ* units and makes a total revenue of OR* by charging a price of OR*/OQ*. At this stage total profit is R*J which is maximum.
The hypothesis is based on a number of assumptions. Prima facie, the decision-maker (manager or entrepreneur) is supposed to have relevant information about cost and revenue on the basis of which an optimal decision can be made. Secondly, he is assumed to have sufficient power to make a decision and implement it properly.
However, the external or market forces — which are beyond the control of a firm or its management — are the major determinants of the firm’s optimal decision on price and quantity. This theory is universally applicable.
Simple Mathematics of the Profit Maximization Hypothesis:
The equilibrium of the profit-maximizing firm occurs simultaneously on the input and output sides — i.e., a firm which is maximising its profit by choosing an output at which marginal cost equals marginal revenue is simultaneously minimizing the cost of producing that output, or maximizing the output subject to cost constraint.
ADVERTISEMENTS:
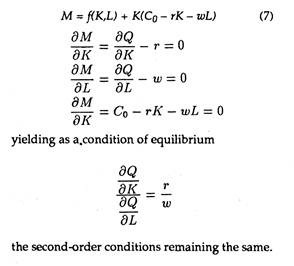
We can now prove that minimizing the cost of the prescribed level of output requires satisfaction of the same condition as does maximization of the output subject to cost constraint. So the latter condition is also a condition for profit maximization.
Minimizing the Cost of the Prescribed Level of Output:
Let
Q = ƒ(K,L) (1)
be the production function, where Q is output and K and L are the quantities of two types of factor services. Let
ADVERTISEMENTS:
Q0 = ƒ(K,L) (2)
be the prescribed output, and
C = rK + wL (3)
where C is total cost and r and w are the factor-service prices of K and L, respectively.
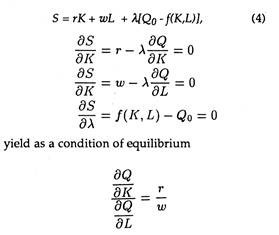
Then, in order to minimize (3) subject to (2), form the function
ADVERTISEMENTS:
ADVERTISEMENTS:
The second-order conditions (not shown) require that the isoquants be convex to the origin.
Maximizing the Output Subject to Cost Constraints:
Given equations (1) and (3) above, let the prescribed cost outlay be
ADVERTISEMENTS:
C0 = rK + wL (6)
Then, in order to maximize (1) subject to (6) from the equation
Maximizing Profit:
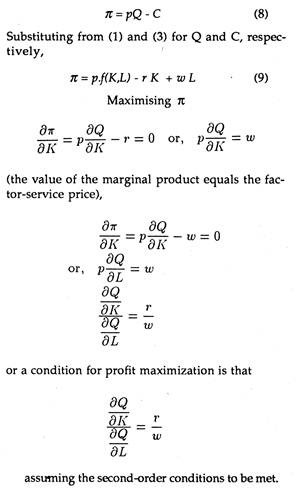
In the case of pure competition, let the price of the goods be represented by p and profit by π. Then, from (1) and (3),
Why Maximum Profit?
From the above hypothesis we may provide two important rationale for maximizing profit.
ADVERTISEMENTS:
Firstly, in a single owner firm, where the entrepreneur is both owner and manager, maximizing profit will maximize his own income. For a given amount of effort this is considered to be rational behaviour, irrespective of the structure of the market (or nature of competition).
If, however, the magnitude of profit varies with the amount of entrepreneurial effort expended, and effort has negative utility (disutility) for the entrepreneur, rational behaviour would dictate something else. He must find an optimal trade-off between effort and profit to maximize entrepreneurial utility which is unlikely to lead to maximum profit.
Secondly the impact of competition from rival firms forces the entrepreneur to maximize profits. Profit maximization therefore is not an aspect of discretionary behaviour (choice) but rather a compelled necessity. The entrepreneur is forced to maximize profit for his long-term survival.
Thus, the justification for profit maximization depends upon the nature of competition. If competition is absent (as in monopoly) there is no such pressure, although the previous argument still holds. Under highly competitive conditions the entrepreneur has to maximize profit just for survival.
Criticisms of Marginalist Theory of the Firm:
The profit maximization hypothesis developed during 1874-1890 by Leon Walras, W. S. Jevons and Alfred Marshall has formed the basis of the neoclassical (marginalist) theory of the firm. It has not been challenged up to the 1920’s. But from early 1930s it has been subject to various criticisms.
Critics have argued that profit maximization is not the only objective of a firm. Modern business firms and their managers pursue certain other goals, too. Thus profit-maximization as the only goal of a firm is no longer a tenable hypothesis.
Being dissatisfied with both of the justifications, modern economists and management specialists have suggested various alternatives to profit- maximization.
The following arguments bear relevance in this context:
1. Emergence of oligopoly:
In the inter-war period it became increasingly apparent, especially in industrially advanced countries, that a modern economy was dominated by oligopoly, a market structure characterized by the existence of a few large firms.
In a number of industries the structure has become gradually more and more concentrated (through merger or amalgamation) so that a few large (and dominant) firms accounted for a major portion of an industry’s output.
In such environments there was hardly any pressure on each firm to maximize profit independently. Instead firms arrived at joint profit maximization through such devices as collusions and cartels. Alternatively put, the pressure from rival producers was not strong enough to dictate profit maximization as an inevitable objective for each firm.
2. Separation of ownership from management:
Secondly, in 1932, Berle and Means challenged, through their pioneering work, the argument that the firm would seek to maximize profits (even though it was necessary due to competitive pressure).
They discarded profit-maximization as a rational behaviour because of an alleged break in the identity of purpose of the manager and his firm. They discovered that in most large U.S. companies there was separation of ownership from control.
Most of such corporations were essentially in the control of the managers rather than the owners (shareholders), due to fragmentation and dispersion of ownership of shares.
Thus, in a handful of cases could a small group of shareholders’ directly affect the decisions of the corporation. In such a situation, with managers acquiring only new shares, the identity of purpose of maximizing profits and maximizing entrepreneurial satisfaction was largely shattered.
In truth, the notion of the entrepreneur has lost relevancy with management becoming an executive function performed by a committee, rather than a simple individual taking all decisions unilaterally (as has been postulated — explicitly and implicitly — by the traditional marginalist approach).
The inevitable consequence of such divorce of ownership from control was that managers may wish to pursue goals other than profit maximization, and would be forced to take into consideration the matter of profits to the extent that sufficient cash had to be generated to pay satisfactory dividends to the shareholders (so that they did not withdraw funds from the company).
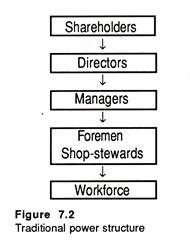
J. Galbraith has noted the change in the power structure in a modern corporation. Figure 7.2 illustrates the traditional Viewpoint with shareholders holding the ultimate power and passing their decisions downwards in a chain of command — i.e., through the board of directors, management and eventually down to technicians and workers.
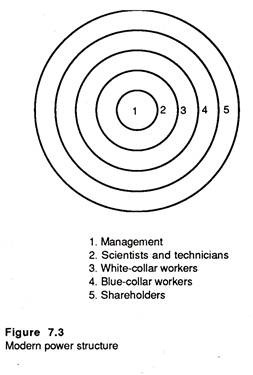
In Figure 7.3, we illustrate the alternative suggested by Galbraith for the modern corporation. Modern power structure consists of a series of concentric rings. Management is at the centre, controlling the firm and each ring outwards is successively less identified with the objectives of managers. Scientists and technicians are closest to managers, followed by white collar workers, blue-collar workers and finally shareholders.
Criticisms of the Modern Approach:
Although this view has been accepted by many modern economists, the trend towards this type of change in power is not universal. Supporters of the traditional viewpoint would argue that the shareholders have ultimate power and, if properly motivated, can exert considerable influence.
At times, at the annual general meeting of a company, shareholders are able to put a lot of pressure on managerial decisions. Secondly, it has been argued that an increase in the number of firms does not necessarily imply growing competition.
There may be keen competition among 3 to 4 dominant firms in an industry. Thus the need for making maximum profit is not stronger under pure competition than under oligopoly.
Those who believe that the profit- maximization is no longer a tenable hypothesis have suggested a number of alternatives.
These fall into two broad categories:
(1) Those who hold that something else other than profit is maximized and
(2) Those who postulate non- maximizing behaviour.
Theory # 2. Other Optimizing Theories:
There are various alternative approaches to profit maximization. Here we restrict ourselves to the most important ones.
Baumol’s Single Period Sales (Revenue) Maximization subject to Profit Constraint:
One alternative to profit maximization has been suggested by W.J. Baumol that firms operating in oligopoly will seek to maximize sales revenue subject to a profit constraint.
His argument is largely, if not entirely, based on “public statements by businessmen and on a number of a priori arguments as to the disadvantages of declining sales, for example, fear of customers shunning a less popular product, less favourable treatment from banks, loss of distributors and a poorer ability to adopt a counter strategy against a competitor.”
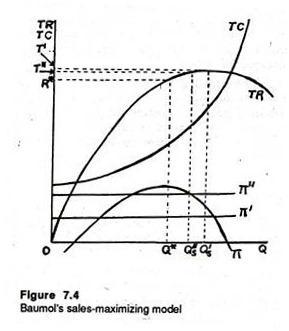
Baumol’s basic argument is summarized in Figure 7.4, which enables us to understand the difference between profit maximization and sales maximization.
Total profit is maximized when the firm produces OQ* units of output (as in Figure 7.1)
Sales maximization, on the other hand, refers to maximization of total revenue ( = P x Q ), rather than maximization of Π (It is because if a firm quotes zero price it can sell an astronomical amount but its total revenue will be zero.) Total revenue is maximum when MR = 0, and MR = 0 when the demand for a company’s product is unitary elastic.
In Figure 7.4 we observed that if the firm wishes to maximize total revenue (without profit constraint) it will choose output Q’s, where TR is maximum (i.e., the slope of the TR curve is zero or MR = 0). However, Baumol has argued that, a constraint operates from shareholders. They require a minimum sum as dividend which would keep them content.
Alternatively put, shareholder demand a level of absolute profit of some amount which is exogenous (i.e., determined outside the model). If this minimum acceptable level of profit were π’, the firm could produce Q”s and still generate profits greater than π’. Hence in this situation it will be worthwhile to produce Q’s.
Likewise if the minimum acceptable profit is π”, Q’s will not generate sufficient profits. The firm will have to reduce output to Q”s which is indeed the optimal output with the profit constraint specified.
Baumol’s model thus predicts that profits will be sacrificed for revenue. The sales-maximizing level of output will exceed the profit-maximizing level and can only be sold at a lower price under imperfectly competitive market conditions.
In fact, the first main difference between the profit maximizer and a constrained sales maximizer is that the latter can charge a lower price to sell the extra (OQ”s – OQ*) output. This has to be the case if both have the same demand (AR) curve.
In terms of Figure 7.4, the profit maximizer produces OQ* and charges a price of OR*/OQ* (= total revenue + output). Alternatively, the sales maximizer produces (in the π” constrained case) Q”s and sells at a price of OT”/OQ”s.
Rationale:
Baumol’s model no doubt carries enormous good sense. The motivation to maximize sales revenue is justified on the ground that the managers of large firms stand to gain more from this strategy than from profit maximization. Sales maximization implies expanding the size of the organization, enhancing the status of managers as also their promotion prospects.
Again their wages and compensation are directly related to responsibility, which, in its turn, is again an increasing function of size. Conversely, as Baumol argues, it is quite irrational for managers to maximize profits for shareholders when they will get hardly anything themselves. (It is just ‘head I win, tail you lose’ type of affair — one-sided game, that is).
Implications and Limitations:
Baumol’s’ model is a single-period sales maximizing model. It applies at a single moment of time — i.e., it is static in nature. However, the model can be made dynamic for an in-depth study of multi-period optimization.
For this it will be necessary to consider various combinations of sales and revenues over time. In that case profit would be endogenous (i.e., determined from within the model) and would form the vehicle for growth through reinvestment of funds. This would enable us to predict an optimal combination of profits and growth rate of revenue. Such a dynamic model is appended below.
With Advertising:
Secondly, advertising has been integrated into Baumol’s model with consequent effect on the total revenue curve. Baumol’s model has the implication that the sales-maximizing firm will spend more on advertising than the profit-maximizing firm.
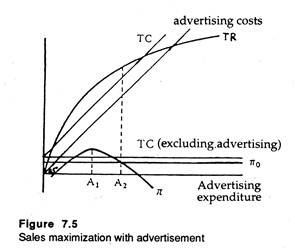
Here Baumol simply assumes that advertising does not affect the market price of the product. But it leads to increase in the volume of sales (with diminishing returns). Hence it is assumed that advertising will always lead to a rise in TR, i.e., MR will never be negative. Baumol’s extended model is illustrated in Figure 7.5.
Here the TC line is derived on the basis of the assumption that advertising (selling cost) does not affect total non-advertising cost. Now we measure advertising expenditure on the horizontal axis, and profit, revenue and cost on the vertical axis.
The TC curve is derived by superimposing the curve showing advertising cost, on the original TC (excluding advertising curve). Since there is positive (though not perfect) correlation between TR and advertising expenditure, the TR curve is upward sloping (its slope is positive though diminishing after a certain point due to diminishing returns).
Since advertising will always increase TR, the businessman will go on increasing advertising expenditure until prevented by the profit constraint.
In Baumol’s model, therefore, A1 will be the profit maximizing level of advertising expenditure, which, if falls short of maximum profits, will invariably be less than the constrained maximizer’s expenditure A2.
Baumol’s model, however, is not free from defects. It is inconsistent in one point at least. If advertising leads to greater output sold, non- advertising costs would be expected to rise. Yet, Baumol, in his simplified model, assumed that they would not.
Mathematical Presentation:
We may now seek to present a mathematical model on the line of Baumol.
We start by defining some important relations:
In Bamoul’s scheme for a profit maximiser, this ratio is always equal to 1.
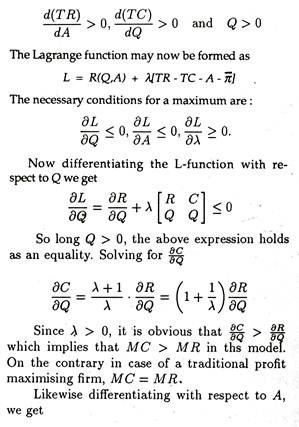
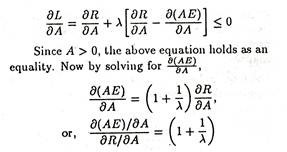
As long as λ > 0, the advertising expenditure will be higher for a sales maximising firm. Thus, for a sales-revenue maximising firm, we arrive at the following
The implication is that excess profit or surplus will be partly utilized for advertising and partly for enhancing production. Baumol’s model can be generalised with respect to multi-product firm. The product-mix of a revenue-maximizer will not be the same as that of a profit-maximizer.
Example 1:
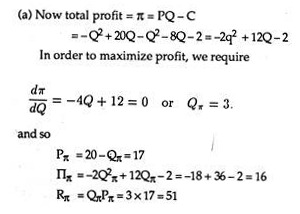
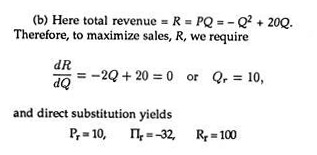
Given the demand function P = 20 – Q and the total cost function C = Q2 + 8Q + 2, answer the following questions:
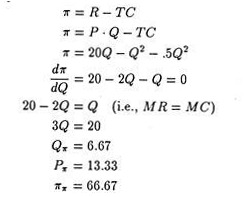
(a) What output, Qπ, maximizes total profit and what are the corresponding values of price, Pπ, profit, Ππ, and total revenue (sales), Rπ?
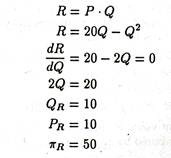
(b) What output, Qr, maximizes sales and what are the corresponding values of price Pr, profit, Πr, and total revenue, Rr?
Solution:
Example 2:
Suppose that a firm has a linear demand function such as P = 20 – Q and total cost is TC = .5Q2. The unit cost functions will be MC = Q and AC = .5Q. Find out the profit maximising level of price and output.
Solution:
The price/output combination that would maximize profit can be determined as
The price/output combination that maximizes sales revenue is found by simply taking the first derivative of revenue (R) with respect to output (Q).
Example 3:
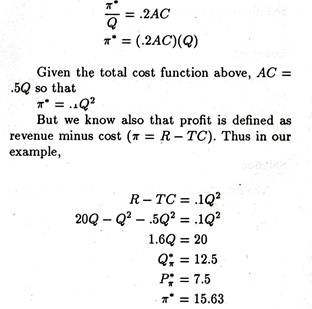
Suppose in example 2 that the firm wants to maximize sales revenue subject to a specific rate of profit (perhaps designed to achieve a particular rate of return). We assume that the firm wishes to constrain their profit to 20 percent of the total unit cost of production. Find out the level of profit.
Solution:
The Dynamic Model:
The multi-period model of Baumol is based on the following assumptions:
The objective of the firm is to maximize the rate of growth of sales revenue over its life cycle.
There is no profit constraint; profit is the main source of financing growth of sales. Profit is thus an instrumental variable whose value is endogenously determined.
Demand and cost curves have traditional shape; average revenue is downward-sloping and average cost is U-shaped.
Suppose sales revenue (R) grows at a rate of growth (g) per cent.
Over its whole life the firm will have the following stream of revenues:
R, R(1 + g), R(1 + g)2… R(1 + g)n
The present value of this stream of future revenues can be computed by applying the usual discounting procedure.
where r is the rate of discount determined by the level of expectations and risk preferences of the firm.
The total present discounted value of all future revenues is expressed as:
The firm seeks to maximize s by choosing an appropriate combination of current values of R and g. It is pretty obvious that
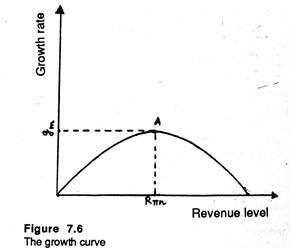
Also note that g = g(π, R) is the growth function and π = π (R, C, g, r) is the profit function. The- growth function is derived from the profit function. Growth is mainly financed by ploughed back profits which depend on current level of revenue (R), cost(C), growth rate of sales (g) and the discount rate (r). To maximize S, the firm can choose a particular combination of R and g out of a set of alternatives.
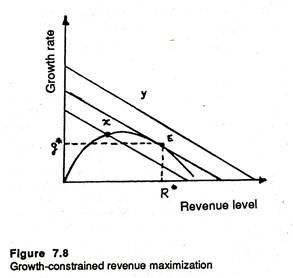
These combinations are plotted along the growth curve, shown in figure 7.6. In this diagram up to point a, which corresponds to maximum profit level, R and g increase simultaneously. Beyond A, R increases but g tends to fall. Thus beyond Rπn sales revenue level and growth rate become conflicting goals.
The optimum combination of R and g may not be a feasible one and vice-versa. Actual choice depends both on desirability and on feasibility. The desirability may be defined in terms of iso-present value curve. This curve is a locus of points showing alternative combinations of g and R which yield the same S.
Here S, the aggregate discounted present value of revenue, depends on R and g, given the exogenously determined discount rate. Thus we may assume that
This is an equation of the iso-present value curve in the slope-intercept form. Thus, it is possible to think of a family of such curves, the highest one representing the maximum present value of S and the lowest one representing the minimum present value. The slope of this straight-line is given by a/b along a given curve, the level of S remains the same.
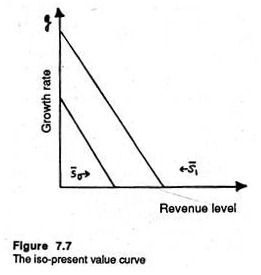
In this case, the equilibrium solution is reached at point E at Figure 7.8 from which it appears that the firm will choose a combination of R* and g* to reach the highest possible level of S, subject to the growth function constraint.
Empirical Evidence:
Two major studies have both verified and falsified Baumol’s hypothesis.
In 1962, McGvire, Chiv and Elling have discovered “that correlation between executive incomes and sales revenue is stronger than the correlation between executive income and profits”. However, such correlation does not necessarily imply causation.
In 1967, M. Hall in a comprehensive study has attempted to test the hypothesis, implicit in Baumol’s model, that if profits above the minimum constraint are earned, ceteris paribus, firms pursue policies (for example, cut prices, increase advertising and investment) in order to increase their sales revenue. The regression results of Hall failed to justify this hypothesis.
Reconciling Short and Long-term Profitability:
There are, of course, a few practical problems in reconciling profit maximization in the short run with the long-term interest of the firm. A realistic strategy seems to be to always increase its profits in the short term by cutting down costs which ensure its long term survival, i.e., maintenance and investment. Simply put, there is danger of offending customers by excessive profit-making openly in the short run.
Williamson’s Model and Maximization of Management Utility:
In his article, ‘Management Discretion and Business Behaviour’ in American Economic Review (1863), O.E. Williamson presents a model of managerial discretion.
His model is based on the same assumption as Baumol’s: a weak competitive environment, a divorce of ownership from control, and a minimum profit constraint imposed by the shareholders. He argues that managers of such large firms conduct the affairs of the firm to serve their own interests.
In other words, managers are concerned with the goodwill of the firm only to the extent that it favours their own personal motives and ambitions. He argues that the most important motives of businessmen are desires for salary, security, dominance and professional excellence. All these yield additional utility or satisfaction to the manager.
These can be gained by incurring additional expenditure on staff, managerial emoluments and discretionary investment. Williamson argues that managers have discretion in pursuing policies which maximize their own utility rather than seeking the maximization of profits which maximize the utility of most shareholders (i.e., the owners of the company).
In Williamson’s model, each manager is supposed to have a utility function — i.e., a set of factors which provide managerial satisfaction. Such utility arises from certain aspects of the management task — e.g. responsibility, prestige, status, power, salary, etc.
These aspects can be reduced to three component terms in the utility function as follows:
U = ƒ(S, M, Id)
where U = managerial utility, S = staff, M = Managerial slack, absorbed as a cost, and Id = discretionary power for investment. Of these, only staff is measurable. Others are non-momentary and non-operational. Still these can be measured indirectly in terms of other variables. The objective of the manager is to maximize U.
An increase in the staffing level — or an expansion of the ‘span of control’ (i.e., the number of people under the direct control and supervision of the manager) confers benefits to the managers in the form of higher salary. Usually other things being equal, a manager, in charge of a team of 30 people is paid more than another manager in charge of a smaller team.
However, there are other positive aspects of the staff term (S) such as the higher status of managing a bigger team, and the stronger chance of promotion which comes from greater responsibility and authority.
In short, the quality and number of staff reporting to a manager enables him to gain promotion, salary and dominance as also security through greater confidence as to his departments’ survival, and greater professional excellence which a large staff, by providing better services. Thus the staff term is a much wider one than simply measuring managerial salary.
The second term management emolument (M) represents the type and amount of perquisites the manager usually enjoys (such as luxurious, decorated and equipped offices, personal security, allowances for the use of a car, expense account for entertainment) beyond the level necessary for efficient operation.
The term M reflects the utility derived by the manager from being able to authorize expenditure of the firm to serve his own needs. The greater the M, the greater the status, prestige and satisfaction of the manager. (This is what goes by the name of managerial slack).
The third component — discretionary investment expenditure (ld) or the power to make such investment — involves ‘unnecessary’ expenditure by the firm to serve the ends of the manager. Here the term ld refers to that investment which exceeds that necessary to achieve the minimum after tax profits demanded by shareholders.
The manager is often able to undertake projects which appeal to him in particular but which may not necessarily be the best in terms of generating profits for the firm. Examples of such investment are terminals linked to a computer, mini-computers, automated equipment for data processing and record keeping.
Such projects do not provide any monetary benefit to the manager but reflect his fascination for what is ‘new’, what can be deemed as ‘scientific progress’ and what may put him above other managerial staff in terms of esteem and status. Such investments permit managers to pursue their personal investment preferences and to exercise their power. Hence Id provides utility.
In Williamson’s model, the utility function is maximized subject to the constraint that satisfactory profits are earned to fulfil the shareholders’ expectations. He predicts from his model that in most normal situations the firm will act in such a fashion that M and are both positive. The implication is that ‘unnecessary’ expenditure is tolerated by the shareholders.
The normal situation is supposed to be one in which the firm enjoys discretionary ‘power’ in fixing output and price if there is not much competition in the market. In such a situation S is also positive, which implies that excess staff has a positive effect on managerial utility.
In times of business recession, it becomes difficult to earn satisfactory profits. Hence the components of the utility function are appropriately adjusted for cost reduction. Excess staff is laid off, expense accounts are made more stringent, and unnecessary prestige investments are cut back or postponed.
Comparison with Other Models:
Williamson’s model can be compared with the traditional model presented by the marginalist school. In a highly competitive environment, M and ld would have to fall to zero if profit is to be maximized. Moreover, excess staff has to be removed. In this limited case the predictions of Williamson’s model would be similar to that of the traditional marginal approach. But this is unlikely to happen in reality.
Williamson’s model may also be compared with Baumol’s. Whereas the profit-maximizing firm of the traditional model and the sales maximizing firm of the Baumol’s model report actual profits, Williamson’s firm announces only ‘reported’ profits.
Reported profits, i.e., the profits admitted by the firm equal actual profits less M. M is deducted because it is an expenditure and is also a deductible one for tax purposes. It is interesting to note that in Williamson’s model, actual profits may not equal maximum profits if, as the model predicts, S exceeds the profit maximization level.
Mathematical Presentation:
Williamson’s model was initially presented mathematically. We present the same here (as optional reading) for the benefit of over-ambitious (post-graduate) students.
Williamson’s model of the managerial utility- maximising firm is based on some basic terminology, relations and definition.
These are the following:
(a) The demand of the firm, P:
The firm is supposed to have a known downward sloping demand curve such that
P is price per unit
Q is output
S is staff expenditure
E is a demand shift parameter.
(b) The production cost, C:
Cost is a function of output, i.e., it depends the level of output such that
(c) Actual profit, Πa:
Actual profit is sales revenue less total costs including staff expenditure
πa = R – C – S
(d) Reported Profit, Πr:
This actual profit is reported to the tax authority after deducting of managerial emoluments
πr = πa – M = R = C – S – M
(e) Minimum Profit Π*:
This is indeed the minimum amount of profit (after tax) needed to pay satisfactory dividends to the shareholders, without which the ‘job security’ of the manager may be at stake. Thus
(f) Discretionary investment, Id:
This is a residue of the amount left from the reported profit after setting aside the critical minimum profit and meeting the tax obligations. Thus
Id = πr – Π* – T
(g) Discretionary profit, ΠD:
This is also a residue, i.e., the amount of profit left after subtracting the minimum profits and the tax
πD = πa – Π* – T
The Complete Model:
We may now present the complex Williamson model. Williamson states the optimisation problem thus
He assumes that the marginal utility of each of the component of the utility function is positive but diminishing. The implication is that S>0, M>0 and Id>0. As soon as this assumption is made the constraint loses it relevance. This enables Williamson to treat this optimisation case as a simple case of unconstrained utility maximization.
Substituting
Πr = Πa – M = R – C – S – M
and T =T + t(R – C – S – M)
we arrive at the following expression:
u = ƒ[S,M,{(1+t) (R – C – S – M) – 0)]
We may also substitute M as follows. If we define P as the ratio of retained to actual profit we get:
Here (1 – P) is the proportion of profits absorbed by emoluments. So the managerial utility function can be presented in the final form, thus:
U = ƒ[S{(1 – P) (R – C – S), P(1 + t) (R – C – S) – Π*}]
Williamson assumes that t and Π* are being exogenously determined. So he is left with three policy variables: Q, S and P. Thus in his model manager has to choose such values of these variables that maximise utility.
Suppose now we denote the first partial derivative of U with respect to S, M and Id as U1, U and U3, that is
So the total differential of the managerial utility function will now be
dU = U1 (dS) + U2 (dM) + U3 (d Id)
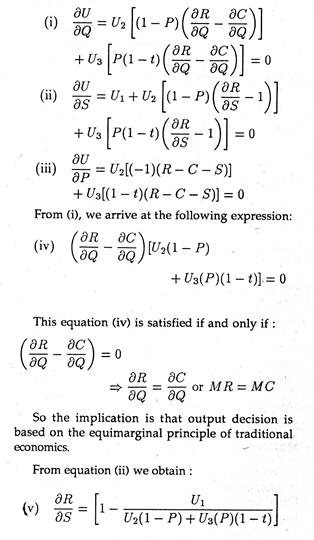
If we equate the partial derivatives of the managerial utility function to zero (i.e., if we fulfill first order conditions) and take into account the above total differential, we arrive at the following:
Since all elements appearing in the fraction are assumed to be positive, it logically follows that ∂R/ ∂S < 1. Then implication is that the managerial firm will employ administrative staff beyond the optimum level (i.e., beyond the point where MR = MC).
Thus it seems that there is a tendency for a managerial firm to overspend on staff or to employ more administrative staff than a traditional profit-maximising firm of neo-classical economics.
Finally, from equation (iii), we arrive at
(vi) (R-C-S)[-U2 + U3 (1 + t)] = 0
Since we know that (R – C – S) > 0, for (vi) to be zero, we must fulfil the following equation:
[-U2+U3(1 + t)] = 0
or U2=(1 + t) U3
The implication is clear : it is absolutely essential to absorb some amount of profit as emoluments, the exact amount depending on the tax rate : higher f, the smaller U2/U3, the smaller the marginal rate of substitution of emoluments for discretionary investment, and the more will be spent on M and the less on Id.
Implication of the Model:
In the following table we seek to make an overall assessment of the utility-maximising firm vis- a-vis the profit maximising firm:
E. Penroe, in his book The Theory of Growth of the Firm describes all types of growth (internal and external) to the availability of managerial resources to plan growth. At any time there will be a range of opportunities for expansion open to the firms.
Since all these cannot be exploited choice must be restricted to those which can be effectively planned. The implication is that there must be available spare managerial capacity at the right level over and above that needed for the smooth conduct of current operations.
In her scheme the ultimate limit to growth, under static conditions (i.e., when there is no change in the state of knowledge or in the quality of managerial services), is set by managerial discretion. If, however, improvements in these occur under more realistic conditions, the limits recede to the background for extended periods of time.
Marris’s Model of Managerial Enterprise:
An alternative managerial theory of the firm has been developed by Robin Marris. It also stems from the so-called dichotomy between ownership and control. He suggests that a possible goal which has connections with both sales and profits is that of growth of the firm. So managers will have varying objectives apart from profit.
These non-profit objectives are strongly correlated with the size of the firm, examples being salary, power and status. An important exception is that of security, since in recent years managers, even in larger firms, have found themselves declared redundant.
In fact, Marris, like Williamson, hypothesizes that managers have a utility function in which salary, prestige, status, power, security, etc. all assume significance. On the contrary, the owners (shareholders) are usually more concerned with profits, market share and output.
In contrast to Williamson, Marris suggests that on one aspect at least, there is no conflict between the two groups — the management team and the shareholders. Rather there is harmony of interest.
They have a common interest in the size of the firm. Thus he postulates that members of the management team will be primarily concerned with maximization of the rate of growth of size. By size he means: ‘corporate capital, that is, the book value of fixed assets, plus inventory, plus net short- term assets, including cash revenue.
Managers feel interested in growth rate of size because positive growth is supposed to enhance the promotion prospects of managers. In Marris’ model the stress is on an alleged preference of managers for internal promotion (rather than through changing firms). This is possible if and only if the firm expands rapidly over time.
However, Marris suggests that there are certain factors which operate within the firm to limit the growth process such as:
(1) The ability of managers to cope with and administer a rapidly growing organization without any loss of control,
(2) The ability of managers to develop and introduce new products to neutralize the losses inflicted by products experiencing falling market shares and
(3) The ability of the research and development expenditure to generate an expanding flow of potential new products.
However, the major constraint on growth seems to stem from the managers’ desire for security, which largely, if not entirely, depends on the financial side of the enterprise. Managers of big companies do not want to lose their jobs. Thus they never pursue the growth objective beyond limit so that the company suffers from financial stringency and its very existence is at stake.
In other words, the desire of the management for job security implies a deliberate brake on the growth process. If job security is accorded the highest priority among managerial objectives the firm has to grow in such a fashion that its financial side is not damaged.
Since excessive dependence on external finance (i.e., on the capital market) implies loss of control or too much borrowing ( by selling bonds or debentures ) may enhance the chance of take-over by another firm and pose a threat to the job-security motivation of the managers. Hence there is desire for growth financed mainly from the profit levels being generated by the existing products.
Hence Marris postulated a theory of balanced growth, i.e., growth in demand for the firm’s products (arising from the development and launching of new products), balanced by growth in supply (i.e., growth in stock of capital necessary to introduce new products).
The need for balanced growth is felt for two reasons. Prima facie, there are risks in expanding too fast by undertaking very risky projects, by putting undue pressure on the managerial input, and/or by incurring huge debt to finance the expansion.
By contrast, there are dangers associated with slow growth such as lack of initiative in identifying new products or markets, excessive revenues not being invested into new projects, and, above all, allegations of slack or uninventive management.
The failure on the part of a firm to expand rapidly enough could lead to take-over bids by other firms with more active, energetic and dynamic managers who are aware of the potential which is not being utilized in the slow-growing firm.
Formal Presentation of the Model:
Thus, Marris has presented a dynamic model of the firm, by stating clearly the objectives and constraints. However, he presents his model formally in mathematical and/or graphical form. We present below the model in a simple mathematical form.
Objectives and Constraints:
In Marris’s model the optimization goal of the firm is maximization of the balanced rate of growth (G) which internally depends on two factors: the rate of growth of demand for the firm’s product (Gd), and the rate of growth of capital supply (Gs). Thus
G = Gd = GS
The firm seeks to pursue this balanced growth objective, subject to two major constraints: managerial and financial. The managerial constraint is set by the skill and efficiency of available manager’s team. The financial constraint is set by the desire of managers to attain the maximization of their own utility function and their owner’s utility function.
In a modern organization, there is separation of ownership from management (control). This is why owners and managers are supposed to have conflicting interests. But at times there may be harmony of interests. One such common area of interest, not only ensures fair returns on owner’s capital but also continued trust and faith in managers who have succeeded in achieving it.
If the firm is unable to achieve balanced growth, managers run the risk of losing their jobs as owners’ capital is at stake. Thus when the goals of managers and that of owners coincide, they may collaborate in their endeavor to achieve a common goal, viz., balanced growth of the firm.
It is against this backdrop that Marris specifies two different utility functions one of the manager and the other for the owner.
The utility functions of the manager (Um) include such variables like salaries, power, status, job security etc., while treat of the owner (U0) includes variables like profits, capital, output, market-share, public esteem, etc. But in the ultimate analysis most of these explanatory variables are related to the size and steady growth of the firm.
Thus in Marris model we have:
Um = m(Gd,S)
U0 = O(Gs)
At the outset, Marris treats S as an exogenously determined constraint by assuming that there is a saturation level of job security. Above that critical level, (∂Um/∂s) = 0, while below that level, (∂Um/∂s) = α. If this assumption is made the managerial utility function may be expressed as Um = m (Gd)s̅ where
s = s̅ is the job security constraint.
We may now have a fresh look at the above constraints. We may first focus on the managerial constraint. Marris adopts Penrose’s thesis that there exists a definite limit on the rate of managerial expansion such that ‘managerial ceiling’ sets an upper limit to the growth of a firm.
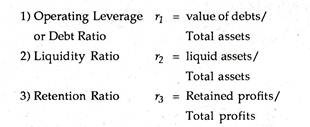
Secondly the financial constraint can also set a limit to growth and this constraint originates in the job- security considerations. In view of job-security, the managers become risk-averters by choosing a prudent financial policy which consists of determining optimum levels of the following critical financial ratios:
These three ratios may now be combined into a single parameter, r, to represent the financials security constraint.
To affect the balanced growth of the firm, Marris make use of instrumental variables.
r, the financial security co-efficient
d, the rate of product diversification
p, the average profit margin.
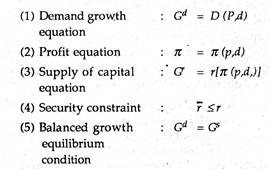
Now by combining the set of objectives, constraints and instruments, we may present the complete model thus:
Structure of the Model:
In this model the level of profit, n, is endogenously determined, i.e., determined from within the system whereas the security constraint, r, is exogenously determined by the attitude of the managers toward risk. Given this, the balanced growth can be ensured through the operation of two instrumental variables, p and d.
In balanced growth formulation we have, in fact, one equation in two unknowns:
D (p, d) = r̅ [∏(p,d)]
Comments:
Thus from Marris’ dynamic model emerges the possibility of an optimum growth rate of the firm through time in a more or less unchanged environment.
In finding this optimum Marris has referred to two major constraints — management capacity to successfully generate greater demand (i.e., managerial constraint) and ability of existing products to generate sufficient after-tax profit for reinvestment (i.e, financial constraint).
There is also a third constraint, namely, profit. On this point Marris’ model resembles that the Baumol and Williamson very closely. Likely them, Marris also includes a profit constraint so that if the growth-maximizing solution fails to generate sufficient profits, growth will have to be sacrificed somewhat to increase current dividend payments so as to fulfil the expectations of shareholders.
From the point of management Marris’s model throws light on two important factors: the attitude to risk and unvertainty and the desire for utility (subject to security maximization) which may not be maximized by the pursuit of maximum profits.
We have noted that the most celebrated managerial models are those of Baumol, Marris and Williamson. They are distinguished primarily by the assumed objectives of the managers. Baumol suggested that managers maximise sales revenue, Marris that they maximise growth, and Williamson that they maximise a utility function including ‘staff or ’emoluments’.
In each case the existence of monitoring from outside and limits to managerial discretion were explicitly recognised. Baumol included a minimum profit constraint in his model, and Marris similarly incorporated a valuation ratio constraint to reflect external pressure, i.e., from shareholders. The value of the assets of a firm. According to Marris too low a ratio will involve a risk of takeover ‘unacceptable’ to the management.
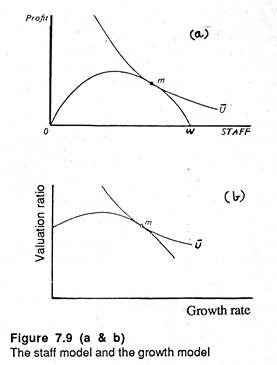
In many ways figure 7.9 is absolutely typical of diagrammatic representations of managerial models of the firm. In Williamson’s managerial firms the constraint OW [Figure 7.9 (a)] is derived as the summation of marginal revenue minus marginal cost.
In other words Williamson’s firm is a monopolist. For Marris the diagram is again basically the same with the horizontal axis now measuring the rate of growth and the vertical axis the valuation ration [Figure 7.9 (b)]. The constraint is not supposed to emanate from the origin but is likely to have the same concave shape.
If growth is pushed past a certain point the value of shares on the market will fall as diseconomies associated with staff training and encountered (Penrose effects) and as a greater proportion of earnings are retained in the firm to finance expansion instead of being distributed as dividends to shareholders.
Theory # 3. Non-Optimizing Theories:
By criticizing the profit-maximization hypothesis modern economists have developed certain theories of the firm which do not hypothesize any optimizing behaviour. We have noted that the most celebrated managerial models are those of Baumol, Marris and Williamson.
They are distinguished primarily by the assumed objectives of the managers. Baumol suggested that managers maximise sales revenue, Marris, that they maximise growth, and Williamson, that they maximise a utility function including .’staff or ’emoluments’.
In each case the existence of monitoring from outside and limits to managerial discretion were explicitly recognised. Baumol included a minimum profit constraint in his model, and Marris similarly incorporated a valuation ratio constraint to reflect external pressure, i.e., from shareholders.
The valuation ratio is the market value of outstanding equity shares divided by the book value of the assets of a firm. According to Marris too low a ratio will involve a risk of takeover ‘unacceptable’ to the management.
In many ways figure 7.9 is absolutely typical of diagrammatic representations of managerial models of the firm. In Williamson’s managerial firms the constraint OW [Figure 7.9 (a)] is derived as the summation of marginal revenue minus marginal cost.
In other words Williamson’s firm is a monopolist. For Marris the diagram is again basically the same with the horizontal axis now measuring the rate of growth and the vertical axis the valuation ratio [Figure 7.9(b)].
The constraint is not supposed to emanate from the origin but is likely to have the same concave shape.
If growth is pushed past a certain point the value of shares on the market will fall as diseconomies associated with staff training are encountered (Penrose effects) and as a greater .proportion of earnings are retained in the firm to finance expansion instead of being distributed as dividends to shareholders.
Satisficing:
Being dissatisfied with the profit- maximization models of economists in 1955, H. A. Simon (the 1978 Nobel Laureate in Economics) has put forward the hypothesis that firms run by single enterprisers (who are also the owners) are likely to have different objectives from firms operated by modern executives in large corporations (who are supposedly not the owners).
Simon argues that managers in most cases have imperfect knowledge and inadequate information on the basis of which to take decisions.
In fact, if perfect knowledge and complete information were not available, the calculations involved in the decision-making process would be too complex to be practicable; and that, given this and the other inevitable uncertainties surrounding the decision making process in reality, business people can never be confident whether they are maximizing profits or not. Instead, business people “satisfice” rather than maximize, i.e., their aim is to earn just satisfactory profits.
Simon basically puts forward the proposition that firms have an ‘aspiration level’ which they seek to reach. In fact, what the satisfactory aspiration level of profits will be depends on past experience and will take account of future uncertainties, too. This level may be in terms of sales, market share, profits, etc. For any -fixed period of time actual results are compared with the aspiration level.
If actual performance exceeds the aspiration level, no corrective action is called for. Instead the aspiration level for the next period is revised upward. On the contrary, if actual performance falls short of the aspiration level, the firm attempts to identify or search out the causes of discrepancy by spending sufficient time, effort and money.
Alternatively, if no apparent inefficiency is found (and the shortfall is believed to be due to external factors — factors beyond the control of the firm or its management) the firm will be constrained to revise its aspiration level for the next period downward. The aspiration level is, of course, the consensus of what can reasonably be expected in near future in the light of past performance.
However, since the cost of gathering information is high, all the alternatives will not be explored. A satisfactory alternative course of action if likely to be selected. This will probably not be the profit- maximising alternative.
Simon also argues that if neither search behaviour nor the lowering of aspiration levels quickly results in the achievement of a ‘satisfactory’ situation then the manager’s behaviour pattern will become one of apathy or of aggression. In this sense this model does not have managerial usefulness.
Simon has also argued that the effort of trying to squeeze the last rupee of profitability out of the operation of the firm is likely to put extra strains and stresses on the business manager which is most cases, may not be liked by him.
He therefore seeks to reach a level of profit which yields an income which he regards as satisfactory and does not put any special effort to extract any extra rupee of benefit. He satisfies rather than maximises.
The validity of Simon’s hypothesis (i.e., the desire of businessmen for quiet life) largely depends on the business environment. In a highly competitive environment, a businessman has to work hard in order to safeguard his position (and thus protect his market share), whether he likes it or not.
On the contrary, if there is not much competitive rivalry in the area of business in which he is operating, he can afford the luxury of ‘quiet life’ and Simon’s hypothesis may carry enormous good sense.
However, a related point may be noted in this context. In a single-owner firm (i.e., sole proprietorship concern) it is possible for the owner-manager to ‘satisfice’ rather than maximize. But it is not possible for the head of a managerial team in a joint stock company to behave like this.
He may well be subject to various pressures from below to pursue a more expansionist policy. The pressure may come from those who are ambitious but are placed less comfortably than he is (i.e., at a lower point in the organization chart).
Shareholders may also demonstrate this type of ‘satisficing’ behaviour. A private shareholder is always at liberty to sell the share of a company if he is not satisfied with its performance and feels that he can secure a better return on his investment elsewhere.
But he is usually constrained by a lack of information. Thus he tends to act as a ‘satisficer’ so that if, for instance, dividends are held at a customary level, shareholders do not usually inquire whether they should be higher if management were better.
Comments:
Simon’s hypothesis is not altogether wrong. There are firms or business people in reality which pursue ‘satisficing’ behaviour. As noted by W. D. Reekie and J. N. Clook, “It does help explain why some firms, faced with a falling market share, act more vigorously than competitors, in an attempt to halt the decline, while others, conversely, in the same situation, act as though they were commercially moribund.”
However, Simon’s theory of satisficing rather than optimising behaviour forms the basis for a more detailed analysis of the objectives of firms as spelled out by Cyert and March in their behavioural theory of the firm. We may now turn to the behavioural theory.
The Behavioural Theory of the Firm:
In their book A Behavioural Theory of the Firm (1963), Cyert and March go a step ahead of Simon in making an in-depth study of the way in which decisions are made in the large modern (multi- product) firm (characterized by divorce of ownership from management) under uncertainty in an imperfect, market.
They have expressed more concern in the decision making process than in the objectives or motivations of such firms (e.g., profit/sales maximization and satisficing). They look at the bureaucratic structure of the firm and study the nature of interrelationships of its various parts.
At the outset Cyert and March declare that if we are to develop a theory that predict and explain business decision making behaviour, the following two points have to taken note of:
(i) People (i.e., individuals) like organizations have goals,
(ii) In order to define a theory of organizational decision making, we need something analogous — at the organizational level — to individual goals at the individual level.
Cyert and March set the formation of organizational goals through the notion of a coalition. The firm itself is visualized as a coalition of individuals who are organized in sub-coalitions. So they differ from Baumol and Simon who have assumed that the firm is dominated by a single person who makes the decisions and whose authority is unquestioned.
Instead Cyert and March assume that the firm is a decision-making entity in its own right. They have recognized that management must achieve an objective, or possibly a set of objectives, through the efforts of a group of persons or through a coalition.
The coalition consists of the various units or parties associated with the firm such as managers, workers, shareholders, customers, suppliers as also professional people like accountants, auditors, lawyers, etc.
As with most others, such coalitions are not necessarily stable. Membership may change over time and also when particular decisions are involved. Within any group there is unlikely to be any permanent unanimity of purpose, although it may be worthwhile or expedient to act for a time as though there were. There is still less chance of acceptance of the goals of the firm by all the members of the coalition.
Thus the overriding problem of the leader of the coalition, who may be designated as the entrepreneur, is to attempt to resolve the conflict of goals and to keep all members pulling, more or less, in the some direction as long as possible. However, he must always be prepared for an unforeseen situation or sudden emergency.
The starting point of the behavioural theory is “where the entrepreneur makes a contract with the individual whereby the latter agrees to carry out instructions and to accept the organizational goal, or goals, as interpreted by the entrepreneur.” In order to get full support from the subordinates, the entrepreneur has to make ‘side payments’.
Alternatively put, the goals keep on changing through a process of bargaining, in which side payments are involved. Side payments not only involve money but non-pecuniary benefits also like authority, personal treatment, etc.
At the management level these involve matters outside the normal contract of employment (salaries, paid holidays, hours of work, etc.). The most important one seems to be policy commitments of one kind or another. This is known as policy side payment.
Finally, a winning coalition forms and the goals are set. However, the position is not static. Due to continuous changes in circumstances the bargaining is going on most of the time so that the coalition and its goals are liable to alter frequently.
In other words, a process of unrestricted bargaining would be inconsistent with stability in the organization. However, stability can be secured by working outside payments for those situations that are thought likely to occur.
There is, of course, likely to be conflict within such a coalition. Thus it is quite likely that some of the goals may be incompatible. However, such conflict resolution is possible in two ways. Firstly, decisions may be decentralised into divisions and departments.
Therefore conflict may be isolated geographically to ensure that all conflicts do not arise within the same unit. Secondly, crises and conflicts may be dealt with sequentially, i.e., they can be spaced out intertemporally (i.e., over time) and can be tackled as and when they arise.
Five Goals:
Cyert and March go a step further and postulate that the firm may be pursuing the following five basic common goals:
(a) Production goal:
This goal will be set as a target for the period and will have two aspects: level and smoothness. For example, a division may be set up to reach a specified goal (say, producing 100 units of a commodity per day) with the restriction that output should not deviate by more than 10% from this figure.
(b) Inventory goal:
Business firms have to hold inventories because production and sales do not always coincide. It is absolutely essential to hold sufficient stocks of finished goods to meet consumer demand (as and when it arises). At the same time, it is to be ensured that there is no excessive stock holding at high cost.
This goal may be specified in terms of a target level and upper and lower limits may be set.
(c) Sales goal:
This goal may be specified for the future either in volume or in value terms. Moreover it may again be expressed in terms of a level and/or range.
(d) Market share goal:
The firm may set a target related to its share of the market (i.e., the industry of which it is a part for the product concerned). In some cases this may be a substitute for the sales goal, but in other cases it may be a supplementary goal.
(e) Profit goal:
The purpose of setting this goal is twofold: to measure the effectiveness of management and to act as a source of payment of dividends to shareholders.
Search Activity:
The behavioural theory does not postulate goal maximization but seeks sub-optimization or attainable goals. Like Simon, Cyert and March state that firms compare performance with goals. What will be sought at any time largely depends on the level of aspirations. If the goal is met no action will be taken. But in practice the level of aspirations, in most cases, outstrip achievements.
In contrast, if achievement improves rapidly, then it may outstrip aspirations, which may then be revised upwards. In a like manner, where achievement worsens there may be a tendency for a downward revision of aspirations to occur. There is thus likely to be a certain adjustment of goals in the light of experience.
If, however, performance falls short of aspirations (i.e., the goal is not met) a search activity is initiated to identify the causes of non- attainment. If the reason is within the firm’s compass, steps are taken to rectify the non-attainment (i.e., alternative courses of action will be stimulated). This imposes extra costs on the firm and will not be carried beyond the point where a satisfactory solution is found.
If a number of alternatives are found, the best one will be selected and no additional search will be carried out to see whether any further improvement is possible. If the reason is outside the control of the firm (e.g., depressed market conditions due to recession in the economy) the goal for the next period may be revised downward.
Organizational Slack:
Cyert and March argue that the coalition will remain viable so long as the payments are sufficient to keep the members within the organization. So it is absolutely essential to develop a satisfactory ‘package’ of money together with other benefits which will prevent the individual manager from looking for openings elsewhere.
In practice, however, there is likely to be disparity between the actual payment which is made and that which is necessary to keep the individual in the organization.
However, it is not that easy to calculate side payments accurately. Usually payments made, tend to exceed what is really necessary. Such excess payment is termed organizational slack. The concept is of considerable importance in rectifying the non-attainment of goals.
The following three examples bear relevance in this context:
(i) Shareholders are often paid more than what is required to keep them holding shares.
(ii) Wages are often in excess of those required to keep workers within the organization.
(iii) Executives in most cases are provided with luxuries and services in excess of what they really need.
Cyert and March argue that organizational slack (OS) grows naturally as the firm itself grows and prospers over time; it is not a deliberate objective. However, when circumstances become more and more adverse, OS provides the first means of making economies on costs.
Under difficult conditions there will be real pressure to reduce those side payments which can no longer be afforded at their original level. This slimming operation will, in all likelihood, reduce the organizational slack, while, at the same time, still leave the members of the organization sufficiently satisfied to stay within it.
Conclusion:
The behavioural approach of Cyert and March is a dynamic one.
Three major points that emerge from the approach are as follows:
1. The goals and objectives of a firm will emerge from the coalition in existence, at any given point of time.
2. However, there is likely to be a change in coalition, and with it, the objectives pursued by the organization as a whole.
3. Hence, not only different firms will have different objectives at the same point of time, but the same firm may have different aims and objectives at various time periods.
