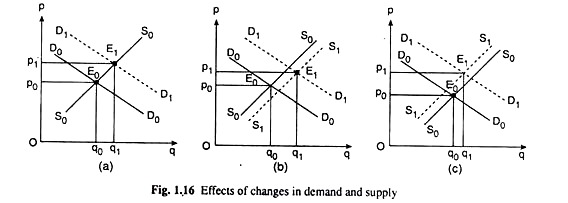
In this article we will discuss about the effects of changes in demand and supply on the equilibrium price and quantity currently prevailing in the market with the help of Fig. 1.16.
This Figure has three parts which depict the effects of an increase in demand if:
(i) Supply remains unaffected,
(ii) Supply increases, and
ADVERTISEMENTS:
(iii) Supply decreases.
In all the three parts, it assumed that D0D0 and D1D1 are, respectively, the initial and changed demand curve, and S0S0 and S1S1 are the initial and the changed supply curves. Also, in all these cases, it is assumed that p0 and q0 are the equilibrium price and quantity in the initial situation, and p1 and q1 are the equilibrium price and quantity after the changes in demand and supply.
In part (a) of Fig. 1.16 it is seen that demand has increased, i.e., the demand curve has shifted to right from D0D0 to D1D1, while the supply remains unaffected, i.e., the supply curve S0S0 does not change its position. As a consequence, both the equilibrium price and the quantity have increased—they have increased, respectively, from p0 and q0 to p1 and q1.
ADVERTISEMENTS:
In part (b) of the figure, it is seen that both demand and supply have increased, i.e., both the demand and supply curves have shifted to the right from D0D0 and S0S0 to D1D1 and S1S1.
Since both demand and supply have increased, equilibrium quantity here would increase—it has increased (substantially) from q0 to q1 On the other hand, increase in demand and increase in supply would have opposite effects on price—the former would push the price up and the latter would pull it down.
However, the net effect would depend on the relative magnitudes of the shifts in the demand and supply curves. Here the price has increased in the net because the demand curve has shifted to a larger extent than the supply curve. The result would have been the other way round if the relative magnitude of the shift in the demand curve is smaller than that in the supply curve.
Lastly, in part (c) of Fig. 1.16, demand has increased and supply has decreased giving rise to a rightward shift in the demand curve and a leftward shift in the supply curve. Here, both the increase in demand and the decrease in supply would have the effect of pushing up the price. That is why, here price has increased (substantially).
ADVERTISEMENTS:
But, in this case, what would be the effect on equilibrium quantity is not obvious. For the rise in demand would tend to increase the quantity and the decrease in supply would tend to decrease it.
That the net effect here has been a rise in the equilibrium quantity from q0 to q1, is due to the fact that the rise in demand is relatively larger than the fall in supply. But the result might have been the other way round if the relative magnitude of the increase in demand were smaller than that in the decrease in supply.
It is seen above how the analysis of market equilibrium would help us to predict the effects of changes in demand and supply of a good upon its equilibrium price and quantity.
It is known as comparative static analysis, because here it actually compare between two static market equilibrium points, viz., the initial equilibrium point like E0 in Fig. 1.16 and the new equilibrium point like E1 that is obtained after the change in demand and supply.
