Taxable capacity denotes the extent to which a person can be taxed. However, as government activities reach progressively high levels, a situation may be encountered in which further increases in expenditures, even if accompanied by comparable or greater increases in taxes, will produce continuous inflation.
This thesis was popularized by Colin Clark, who has maintained that once expenditures and taxes reach a level which is equal to 25% or more of national income, further increases are inevitably inflationary.
Clark maintains that once taxes reach this level, an increasing number of persons in the economy will insist on further increases in factor prices as taxes are raised, incentives will be affected, production will suffer and employers will be less resistant to wage increases.
The general theories of Clark and others have some merit in pointing out that if taxes are pushed indefinitely higher, a point may be reached at which the inflationary influences will exceed the deflationary effects: once this point is reached, progressively greater difficulties will ensue for the government and the economy as a whole.
ADVERTISEMENTS:
True, since 1939, the level of taxation relative to national income increased everywhere. The high level of taxation may have been a contributory factor in pushing up incomes, prices and costs.
It is very difficult to ascertain what is the taxable capacity of people, for it largely depends on what the State does with the revenue from the taxes. The limit of taxable capacity might be considered to be the point beyond which additional taxation would produce economically harmful results such as fall in national income that outweigh the gain from the services provided by the State from this additional taxation.
Where the State uses taxes to provide services for the community, it is really returning to tax payers the money they have paid in taxes though, depending on their income, the gain to the tax payer may be more or less than his level of satisfaction resulting from the payment of taxes.
The Laffer Curve:
ADVERTISEMENTS:
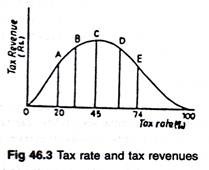
The Laffer curve (Fig. 46.3) is getting a lot of attention these days as a hot idea in economics. But it isn’t at all new a concept—and is not very complicated. The bullet-shaped curve below shows the relationship between tax rates and government revenues. As tax rates rise from zero, revenues increase until an optimum point (C) is reached.
But if taxes are increased further (points D and E), Prof. Laffer says, they discourage consumer spending and business investment, thus reducing revenues. A 100 per cent tax rate would be totally confiscatory, stopping all production and eliminating all tax revenue.
Prof. Laffer believes the U.S. is now operating in the prohibitive range and that a tax cut would actually increase revenues by spurring the incentive to spend and invest.
ADVERTISEMENTS:
Economists disagree on just how- valid the Laffer curve is, and no one knows where the optimum points is—or even the exact shape of the curve. They may find out soon: IBM and American Council on Capital Formation have made a $ 170,000 grant to test an economic model based on the curve.
