The below mentioned article provides a review of growth rates of savings and capital formation during plan period.
Capital formation or investment is the kingpin of economic development. Or one can also say that an important element in the growth process of developing countries like India is the rate of saving or the saving-income ratio.
It is because the accumulation of capital—perhaps the most important source of growth in such countries— depends on the rate of savings.
Savings-and investment are, thus, crucial to capital formation. One of the basic goals of Indian planning is the step-up of the rate of capital formation. In fact, the rate of capital formation or investment has risen substantially during nearly six decades (1951-2007) of planning.
ADVERTISEMENTS:
However, the 70s and early 80s can rightly be called the golden era in Indian savings and investment rate.
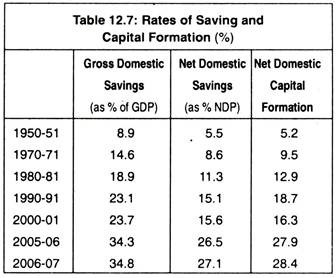
Gross domestic savings increased from 8.9 p.c. of GDP in 1950-51 to 24.8 p.c. of GDP in 2006-07. Net domestic capital formation increased from 5.2 p.c. to 28.4 p.c. during this time. Table 12.7 shows growth of domestic savings and capital formation in the period 1950-2007.
In the 1980s, the performance of the Indian economy in relation to saving-investment rate was respectable by international standards and was certainly high for a market economy and in an unregimented society like India. At present, gross domestic savings stands out around 35 p.c., though less than the level attained in the late 70s.
ADVERTISEMENTS:
However, what was paradoxical in the Indian context is that although the rate of savings and capital formation increased particularly in the late 70s, the rate of growth of the Indian economy as measured by national and per capita incomes was low.
Between 1970-71 and 1979-80, national income grew by 3.3. p.c. while per capita income rose by 1.1 p.c. National income growth rate was in the vicinity of Raj Krishna’s “Hindu rate of growth” 3.5 p.c. This peculiar phenomenon has been dubbed by economists as ‘saving-investment puzzle’.
On the other hand, investment rate in the 1970s increased considerably. For instance, gross capital formation went up from 16.9 p.c. in 1972-73 to 23.7 p.c. in 1978-79. Net capital formation as percentage of NDP also registered phenomenal increase from 11.9 p.c. to 19.0 per cent during the said time period.
The most striking aspect of saving-investment rate of this period was that domestic saving exceeded domestic investment rate between 1975-76 and 1978-79, thus resulting in an outflow of foreign resources.
ADVERTISEMENTS:
During this time, the country also experienced an unprecedented growth of precious foreign exchange reserves but the government could not utilise them in a meaningful way. As a result of all these, domestic savings could not be channelized for genuine investment, though buoyancy in investment rate was clearly visible.
In fact, the high investment rate achieved so far could not be utilised in building up the capital stock of the country.
Meanwhile, capital-output ratio of 2.6 in the 1950s rose to almost 6.21 in the late 1970s. This high capital-output ratio indicates declining productivity of investment (largely due to an inefficient pattern of investment and under-utilisation of production capacity), which largely explains India’s unimpressive growth performance.
Thus, saving-investment problem of the country in the 1970s, on a closer scrutiny, appears to be unsatisfactory. Obviously, the country could not register a higher growth rate.
Saving-investment rate in the 1980s, 1990s and 2000s:
In Table 12.7, we have shown the growth rates of savings and investment in the 1980s, 90s and 2000s. In the 80s, their growth rates were also impressive, though there had been some stagnation in the level of savings in relation to GDP for some years.
Gross capital formation also showed a similar trend. Stagnation in the level of saving in the 80s was due to the fact that net savings of the public sector was negative and low as far as private corporate sector was concerned. Household sector’s savings is still the mainstay of the nation’s saving.
In fact, it continues to grow. Further, one may deserve that the household sector today saves more through financial assets rather than physical assets. However, in recent times because of the rising popularity of housing loans, investment in physical assets is also on the rise.
Also, a variety of consumer loans through banks help people to acquire assets. All these also indicate growing consumerism in the reform decades. Explosive consumerism has its toll on the growth forces. Liberalisation-globalisation mode is yet to develop satisfactory results. Low rates of growth and high rates of savings go ill together with national integration.
ADVERTISEMENTS:
Still then, gross and net saving rates standing around 35 p.c. and 27 p.c. in 2007 were definitely on the high side and comparable to the advanced nations of the world. Needless to say, adequate domestic saving is not an end in itself. What is required is how this increased saving is invested.
It is said that high rates, of investment are critical for rapid growth. Investment rate in the Eighth Plan averaged 24.4 p.c. and it remained almost unchanged in the Ninth Plan. After then it rose and in the Tenth Plan (2002-07), it accelerated to nearly 36 p.c. It is hoped by the planners that such high ratio of investment would be helpful to attain the growth rate of 9 p.c. during the Eleventh Plan (2007-2012).
