The following points highlight the changes that have taken place in the Indian economy after 1951. The changes are grouped into: 1. Quantitative Changes 2. Qualitative Changes.
1. Quantitative Changes:
i. Rising trend of National Income and per Capita Income:
Economic growth of any country is measured by the increase in national and per capita output.
During the plan period, national income of the country has certainly gone up. In 1950- 51, net national product at factor cost or national income (at 1999-2000 prices) stood at Rs. 2,06,493 crore. It rose to Rs. 27,60,325 crore in 2007-08 (at 1999- 2000 prices).
This means that between 1950-51 and 2007-08 national income grew at the compound rate of 4.7 percent per annum.
ADVERTISEMENTS:
Compared to the pre-independence figure, this is really remarkable. However, the performance of the Indian economy in this direction in the 1980s, 1990s was certainly praiseworthy since it recorded a growth rate of more than 6 p.c. p.a. GDP growth rate in the 2000s is unprecedented.
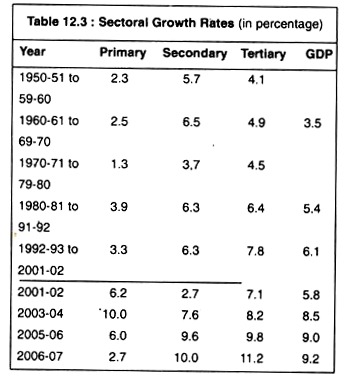
It rose from 5.8 p.c. in 2001-02 to 9.2 p.c. in 2006-07. If the present trend continues, the country will be able to achieve a double digit growth rate within one or two years.
However, the better measure of economic development is the per capita income. Per capita NNP rose to Rs 24,256 in 2007- 08 (at 1999-2000 prices) as against Rs 6,122 of 1950-51 at 1999-2000 prices. This means that during this period, compound annual growth rate of net per capita income rose by 2.5 p.c. p.a.
Historically, it exhibits a better growth rate. Yet, it is inadequate compared to the needs of the country. The only encouraging aspect is that it shows a rising trend.
ii. Increase in Agricultural and Industrial Output:
ADVERTISEMENTS:
Over the plan period, Indian economy experienced a higher growth rate in agriculture as well as in industry. Pre-plan period recorded an agricultural growth rate of 0.3 p.c. while the plan period showed a growth rate of 2.66 p.a. Performance of the industrial sector is certainly a better one.
During the plan period, 1950-2007, the overall achievement in this sector is more than 4.8 p.c. Trend growth of India’s exports shows Indian agricultural and industry on the move.
2. Qualitative Changes or Structural Changes:
During the plan period, not only economic growth picked up, but also economic development i.e., ‘growth plus change’ occurred in India. This amounts to saying that the Indian economy witnessed structural changes.
By economic structure we mean interrelationship among the different productive sectors i.e., agriculture and allied activities (known as the primary sector), manufacturing and industries (called the secondary sector), and trade and services (or the tertiary sector).
ADVERTISEMENTS:
At a low level of economic development, one finds predominance of the primary sector. The predominance of any sector can be viewed from the sectoral composition of national income and occupational structure. When, in an economy, primary sector is considered as the predominant one then it means that the contribution of this sector towards national income is the largest.
Not only this, the bulk of the population derives their livelihood from this sector.
On the other hand, in the sectoral composition of national income as well as in the occupational pattern, the importance of the secondary and tertiary sectors gets reduced. As economic development proceeds, the interrelationships among these sectors undergo a change.
As economic development takes place, the primary sector (from the standpoint of sectoral composition of national income and occupational pattern) loses its importance and secondary as well as tertiary sectors gain in importance. Thus, structural changes indicate economic development. This is what Colin Clark hypothesized.
We will see whether structural changes have taken place in India during the Plan Period:
i. Sectoral Composition of National Income:
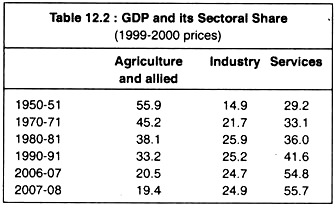
In 1950-51, the contribution of the primary sector towards India’s gross domestic product or GDP was nearly 55.9 p.c., while it was 14.9 p.c. for the secondary sector-Since then there has been a steady decline in the share of the primary sector in GDP and it declined to 19.4 p.c. in 2007-08.
On the other hand, over the plan period, as the industrial sector expanded, its contribution to GDP has been on the rise and it rose to 25 p.c. in 2007-08.
Along with the growth of the secondary sector, the services sector also registered a higher growth rate. In 2007-08, its contribution was 55.7 p.c. Thus, it is clear that as economic development took place during the last five decades of planning, the primary sector lost its pre-eminence, as against 29.2 p.c. in 1950. This, of course, is a sign of economic development.
One can make a better analysis of structural changes if the entire period is divided in the following sub-periods, as shown in Table 12.3:
The GDP growth rate between 1950-51 and 1979-80 came to be known as ‘Hindu rate of Growth’ of 3.5 p.c. p.a. But this long-term trend has been broken and in 2006-07 GDP growth rate went past 9 p.c. p.a. along with the rising growth trend of especially service sector and then industry sector. But primary sector’s performance is rather unsatisfactory in the current year.
It is clear that despite the green revolution in agriculture, the share of the primary sector to GDP has been continuously declining. However, between 1980-81 and 1991-92, primary sector displayed a better growth rate. Variation in the performance of agriculture is always worth noticing.
In the last three or four years, because of good monsoon, agricultural growth rate was remarkable, but in the year 2007-08, its performance has slackened in a larger degree.
ADVERTISEMENTS:
Further, the secondary and tertiary sectors are continuously growing at a double rate than that of the primary sector during the first decades. In the subsequent periods, the tertiary sector outstripped the growth of the secondary sector.
Unfortunately, between 1990-91 and 2007-08, there has been a fall in the growth of the secondary sector from 25.2 p.c. to 24.9 p.c. Thus, the pattern of structural changes that has taken place in India has deviated from developed economies.
Present growth trend is dominated by the services sector. Very aptly, it is called service-led growth. But what we see in India is the ‘excess growth of the service sector’. Possibly, India may display a new paradigm of development.
Another important aspect of sectoral composition of national income is the contribution of the public sector towards GDP. As time progresses, the contribution of this sector rises. In 1970-71, the public sector contributed 14.9 p.c. towards GDP, but it rose to 24 p.c. in 2001-02.
ADVERTISEMENTS:
However, following the introduction of new economic policy in 1991, the contribution of public sector enterprises towards GDP is on the decline. Their share in GDP at market prices declined from 11.68 p.c. in 2004-05 to 11.12 p.c. in 2005-06.
Finally, one can notice a structural change by studying the contribution of the commodity sector and non-commodity or service sector in net national product. Between 1950-51 and 1976- 77, the rate of growth of the services sector (4.90 p.c.) was satisfactory as compared to the growth of the commodity sector (2.90 p.c.).
Furthermore, between 1980-81 and 1995-96, growth rate of the commodity sector came to 5.30 p.c., while that of the services sector rose to 6.50 p.c. Same story has been repeated for the period 1991 -2008.
Expansion of the tertiary sector is tantamount to modernisation. Yet, we must say that the growth of the services sector at the expense of the commodity sector is undesirable. Though sectoral composition of national income itself indicates economic development, the growth of the service sector at the cost of the commodity sector reflects some sort of ‘structural retrogression’.
ii. Occupational Pattern:
In the light of structural change, one finds India’s occupational structure as a static one. But we know that as economic development takes place, occupational structure also undergoes a change. The Clark- Fisher thesis says that, in an expanding economy, employment situation shifts more and more in favour of secondary and tertiary sectors.
That is to say, the number of people engaged in the primary sector tend to decline while it tends to rise in the other two sectors.
ADVERTISEMENTS:
This sort of change in the occupational structure indicates economic development. But, considering the development of the Indian economy in the last six decades, recently one finds some favourable change in the occupational structure of India. Throughout the 20th century, the percentage of people engaged in agriculture has not fallen appreciably.
Even in 2001, 57 p.c. of the total population were engaged in the primary sector, compared to 72.1 p.c. in 1951.
On the other hand, between 1951 and 1981, percentage of population engaged in the secondary sector increased marginally from 10.6 p.c. to 13.5 p.c. but it declined to 12.7 p.c. in 1991 and then rose to 17.5 p.c. in 2001. The only sector that showed a steady rise in employment is the tertiary sector. It rose from 17.3 p.c. in 1951 to 25.8 p.c. in 2000. This is shown in Table 12.4.
Thus, it is clear that the occupational pattern is not only a static one but also an unbalanced one. In view of this, V. K. R. V. Rao commented that India’s occupational structure exhibits ‘structural retrogression.’ This, of course, is not a healthy sign and it explains underdevelopment.
The reasons behind such static occupational structure are:
ADVERTISEMENTS:
(i) Massive rise in population, and
(ii) Inadequate growth of both industries and services sector. Only in recent year (2004-05), there has been a drop in the number of people dependent on agriculture. It is around 52 p.c.
iii. Development of Basic and Heavy Industries:
Immediately after independence, India’s industrial structure was devoid of any heavy and basic industries. In other words, India’s industrial structure at that time tilted heavily in favour of consumer goods industries. But under the impact of planning, especially the Second Five Year Plan (1956-1961), industrial structure had been diversified and newer and newer types of industries had been set up. This symbolizes economic development.
iv. Economic and Social Capital Formation:
By social capital we mean transport, irrigation, power, education, health, etc. Building up of social capital is one of the prerequisites of economic development. Infrastructural development helps quicker economic development. So, social capital formation is equivalent to economic development. During the plan period, we have made rapid strides in respect of construction of railway lines, irrigation, power, health and sanitation, education, etc.
Conclusion:
If all these are considered as criteria for development, then we must say that the Indian economy has witnessed enormous changes which are not only synonymous with development but also help the process of development.
Despite these, black spots of underdevelopment are still prominent. At the same time, it is true that we have been able to come out of the ‘low level equilibrium trap’ engineered by the British Raj. Signs of development are positive in nature.
ADVERTISEMENTS:
Thus, we find both the pictures of development and underdevelopment. It exhibits thus pictures of contrast. The British economist Joan Robinson once remarked about India that whatever could be said about it, so could the opposite. Anyway, Indian economy can be labeled as an ‘underdeveloped-developing economy.’


