Learn about the relationship between Interest Rates and Inflation by Fisher.
Interest Rates:
The interest rate is the amount charged for a loan by a bank or other lenders per rupee per year expressed as a percentage.
For instance, if an individual borrows Rs. 100 and repays Rs. 110 after one year the interest rate is 10%.
Interest rates usually rise with inflation to compensate lenders for the following purchasing power of the rupee. The interest rate minus the expected rate of inflation is called the real interest rates.
ADVERTISEMENTS:
In truth, during inflation it becomes necessary to draw a distinction between nominal interest rate and real interest rate. One of the earliest formal dynamic models was proposed by Irving Fisher (1896) to analyse the relationship between the interest rate and the expected inflation rate. Such a model is inherently dynamic on two counts. Firstly, it involves the rate of inflation, which is the growth rate of the price level. Secondly, the formulation of expectations of the average future inflation rate over the life of the loan is based on the stock of information which accumulates over time. In Fisher’s view, an increase in inflation would not be immediately reflected in the expected inflation rate. This would cause a typical transitional dynamic adjustment.
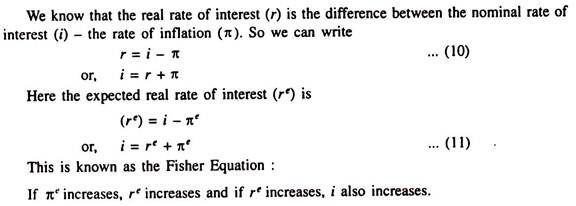
The real rate of interest (r) is nominal rate (i) adjusted for the rate of inflation (π) and is expressed as
r = i – % … (8)
The real rate of interest corrects nominal rate for expected changes in the price level. If, for instance, a bank pays 10% on deposit for a year and a depositor expects inflation to be 6% for the year, then the real rate of interest is 4%. The real rate of interest measures how much a depositor will earn on his deposit after taking account of the fact that inflation will have increased the prices of goods and services that the depositor might purchase in a year. In other words, the real interest rate is the difference between the nominal interest rate and the rate of inflation. In a period of low inflation the distinction between the two rates gets blurred.
ADVERTISEMENTS:
If, for example, the nominal rate of interest is 10% and the rate of inflation is 3% per annum, then the real rate of interest is 7%. Thus, when an individual earns 10% income by way of interest, his spending capacity (purchasing power) increases by only 7%. This is why it is said that during inflation debtors lose and creditors gain.
The Fisher Effect:
From equation (8) we see what true nominal rate of interest is the sum of the real interest rate and the rate of inflation:
i = r + π … (9)
This is known as the Fisher Equation. It shows that there are .two reasons for changes in the nominal interest rate changes in real rate of interest, or, changes in the price level or the rates of inflation.
ADVERTISEMENTS:
The real interest rate is adjusted to ensure saving-investment equilibrium. The quantity theory of money postulates that the rate of inflation is determined by the rate of growth of money supply. The Fisher equation combines the two effects, i.e., it adds the real interest rate and the rate of inflation to determine nominal interest rate.
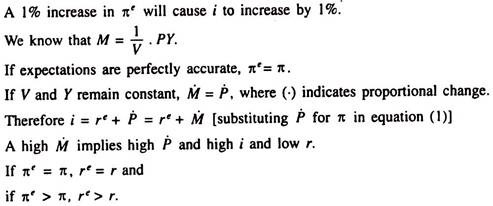
The quantity theory of money and the Fisher Equation together show the effect of money supply growth on the nominal interest rate. According to the quantity theory, 3% increase in M will lead to exactly 3% increase in the rate of inflation. According to the Fisher equation, 3% increase in the rate of inflation, in its turn, causes an exactly 3% rise in the nominal interest rate. The one-to-one correspondence between the rate of inflation and the nominal interest rate is called the Fisher Effect.
The real-rate inflation theory of long-term interest rates, formulated by Irving Fisher in the early twentieth century, is an illustration of partial equilibrium analysis. Fisher broke down observed bond rates into a real component — a reward to the investor for consumption forgone—and an inflation component, which would compensate the investor for the expected depreciation in the purchasing power of currency in terms of principal repayments and of interest during the term of the bond.
Drawing on nineteenth-century predecessors, Fisher held that the real rate was fairly constant: it depends on the combination of the capital stock (on the demand side) and on savings habits (on the supply side). The inflation component, however, was highly variable, depending on actual inflation experience.
No doubt, Fisher’s theory has an intuitively convincing logical foundation. Renewed attention has been paid to this theory along with the mounting inflation and rising interest rates since the late 1960s. The theory has been subjected to extensive empirical testing. It’s one serious weakness is that inflationary expectations are not easily measured directly. (A distributed lag or a more simple averaging of past actual inflation experience, used by Fisher and others, is only a substitute for actual expectations.) Yet the theory is the most satisfactory explanation for the strong general upward trend of interest rates in the late 1970s, and their subsequent decline (with the inflation rate) in the mid-1980s. Also, it has become clear that short-term rates as well as long-term rates react to inflation. However, short-term rates have wider swings than long-term rates and rise less predictably with inflation.
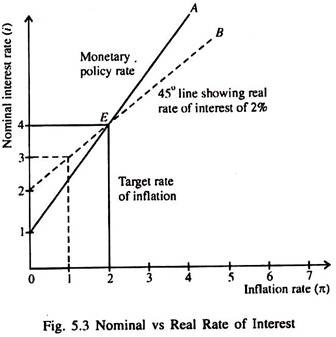
The relationship between the interest rate and inflation rate is illustrated in Fig. 5.3. The nominal interest rate is shown on the vertical axis and the inflation rate on the horizontal axis. The solid line A shows the monetary policy rule: when inflation rate rises above the target inflation rate the central bank takes action to increase the interest rate. The dotted line B shows the relationship between the nominal interest rate and the inflation rates corresponding to a given interest rate. The real interest rate is assumed to be 2% for the dotted line.
An equilibrium occurs where the two lines in Fig. 5.3 intersect. At the intersection point E the real interest rate is equal to its long-run equilibrium value of 2% and the central bank is following its monetary policy rule. The inflation rate is also on target at 2%.
The Derivation of the Fisher Effect:
The Fisher Effect in Terms of the Quantity Theory:
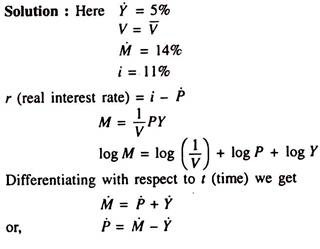
Example:
In the country of Wicknam, the velocity of money is constant. Real GDP grows by 5% per year, the money stock grows by 14% per year, and the nominal interest rate is 11%. What is the real interest rate?
ADVERTISEMENTS:
Alternative Views on Inflation and Interest Rates:
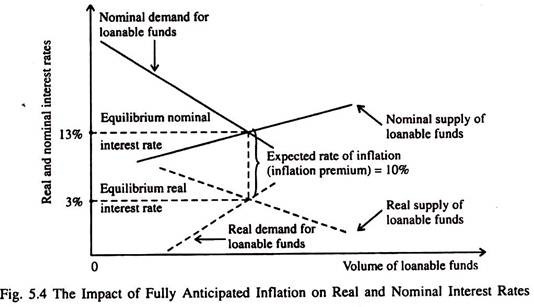
The simple one-to-one relationship between the expected inflation rate and the nominal rate of interest posited by Irving Fisher was the majority view for decades until researchers began to find problems with it. For example, the Fisher effect assumes that inflation is fully anticipated. As an example, let us imagine that both borrowers and lenders of funds expect an inflation rate for the next year of 10% and the real interest rate is 3%.
ADVERTISEMENTS:
We can illustrate this using Fig. 5.4, which shows two sets of demand and supply curves for loanable funds
— a set of real demand and supply curves intersecting at a 3% real interest rate and a set of nominal demand and supply curves intersecting just high enough to fully reflect the expected inflation rate (in this example, 10% points higher than the real rate).
The supply and demand curves for loanable funds both shift upward just enough to ensure that the going nominal interest rate on a one-year loan is 3% plus 10%, or 13%. Lenders will be unwilling to lend money at any rate lower than 13% because they expect the prices of the goods and services they plan to purchase to increase by 10% during the period of the loan.
Suppose, however, that all or a portion of the increase in inflation is unanticipated. In this case, there is no way to be certain about what the equilibrium nominal interest rate will be, for the nominal rate may not fully reflect the amount of inflation expected. The simple one-for-one change in the nominal rate in response to changing inflationary expectations breaks down.
Importance of the Real Rate of Interest:
It is the real rate of interest that affect spending in the economy. Measuring the real interest rate requires an accurate estimation (forecasting) of the expected rate of inflation. It is very difficult to measure people’s expectations of inflation during periods when inflation is very high and fluctuating.
The Expected Real Interest Rate:
ADVERTISEMENTS:
When an individual borrows, lends or makes a bank deposit, the nominal interest rate is specified in advance. But the real rate of interest depends on the rate of inflation over the period of the loan — say, one year. (We know that r = i – π). However, the rate of inflation during the year generally cannot be determined until the end of the year. Thus, at any time that a loan or deposit is made, the real interest rate that will be received cannot be predicted with certainty and accuracy.
Since borrowers, lenders and depositors do not know what the actual real interest rate will be, they have to take decisions about how much to borrow, lend or deposit on the basis of the real interest rate they expect to prevail. They know the nominal interest rate in advance. So the real interest rate they expect depends on their expectations of inflation. The expected real interest rate is the nominal interest rate minus the expected rate of inflation, or
re = i – πe …..(12)
where re is expected real interest rate and πe is the expected rate of inflation. If people’s expectations come true — so that expected inflation and actual inflation are found to be the same — the expected real interest rate and the actual real interest rate will be the same, i.e.,
if πe = π, then re = i – πe = i – π = r.
The expected real interest rate is the correct interest rate to use for studying most types of economic decisions such as people’s decisions about how much to borrow or lend. However, a problem in measuring the expected real rate of interest is that it is not possible to know exactly what the public’s expectation about inflation is.
Indexation:
ADVERTISEMENTS:
Indexation is the tying of deferred payments to the value of an index, usually a price index. Cost-of-living adjustment clauses in labour contracts, the linkage of interest and/or principal payments to the price level (indexed bonds or bank deposits) and the automatic adjustment of tax brackets for inflation are important examples of indexation.
Indexation makes it possible to use long-term contracts even when there is considerable uncertainty about the future price level and, thus, the value of money. In practice, indexation has been most widespread in countries experiencing high rates of inflation such as Finland, Brazil, Israel and Argentina. In recent years, relatively high inflation in the industrialised countries generated considerable interest in indexation.
