It had been assumed that growth manifested itself in the factor growth. Several empirical studies, however, have led to the conclusion that contribution of technical progress in an increase in national income or product is much more significant than that of growth of labour supply or capital accumulation. The effect of technical progress on growth process and trade is much more complex than that of factor growth.
J.R. Hicks has classified the technical progress into neutral, labour-saving and capital-saving.
Whatever is the nature of the technical innovations, they cause a shift of the isoquant towards the origin, the level of output remaining the same. It means the technical progress enables a firm to produce the same quantity of a commodity by employing lesser quantities of the factor inputs.
The technical progress is neutral, when it raises the marginal productivity of capital and labour in the same proportion at the given capital-labour ratio or alternatively, it leaves the capital-labour ratio unchanged.
ADVERTISEMENTS:
The technical progress is said to be labour- saving, when it raises the marginal productivity of capital relative to that of labour at constant ratio of capital to labour. In other words, in case of labour- saving or capital-using technical progress, the capital- labour ratio marks an increase.
The technical progress is capital-saving or labour-using, when it causes an increase in the marginal productivity of labour relative to capital at the given capital-output ratio. In case of such technical progress, the capital-labour ratio undergoes a decline.
The neutral, labour-saving and capital-saving technical progress is shown through Fig. 11.8.
In Fig. 11.8, labour is measured along X-axis and capital along the Y-axis. Given the prices of two factors, the original factor price line is KL. The original isoquant Q indicates the output of 100 units of, say commodity A. The tangency of line KL and Q occurs at R. In Fig. 11.8. (i), as technical progress occurs, the isoquant Q shifts to the left Q’ and the equilibrium shifts from R to R1. The capital-labour ratio (K/L) is measured by the slope of the same line OR and OR1. It means there is no change in capital-labour ratio. This signifies that technical progress is neutral.
ADVERTISEMENTS:
In Fig. 11.8, (ii), the technical progress shifts the isoquant from Q to Q’ and the equilibrium shifts from R to R1. The K/L was measured initially by the slope of the line OR and subsequently by the slope of the line R1. Since OR1 is more steep than OR, the K/L has increased. At R2, the K/L is the same as at R but there is less use of labour than at R. Even at R1, there is less use of labour than at R. It is, therefore, clear that technical progress is of the nature of labour-saving and it raises K/L.
In Fig. 11.8, (iii), the technical progress shifts equilibrium from R to R1. K/L is lower at R1 than at R because the slope of the line OR1 is less than that of OR. If K/L remains constant, 100 units of A can be produced at R2 where less input of capital is employed than at R. Even at R], there is less use of capital than at R. It signifies the technical progress is capital-saving or labour-using.
Assumptions:
ADVERTISEMENTS:
The three different types of technical progress can have varying effects on output and international terms of trade.
This analysis is attempted on the basis of the following assumptions:
(i) The home country experiences growth on account of technical progress.
(ii) This country produces two commodities X and Y.
(iii) X is a labour-intensive but Y is a capital- intensive commodity.
(iv) The production functions related to two commodities are linear homogenous.
(v) The level of output of each commodity is expressed through its respective isoquant.
(vi) The isoquants can cut only once.
(vii) There is no change in the supplies of factors.
ADVERTISEMENTS:
(viii) The factors of production are mobile.
(ix) There are the conditions of perfect competition in the economy.
1. Neutral Technical Progress and Trade:
If the technical progress is of a neutral character and it takes place in export industry of the country, it will lead to a deterioration of terms of trade of the country. On the opposite, if the neutral technical progress occurs in the import-competing industry of the country, it will result in the improvement in the terms of trade of this country.
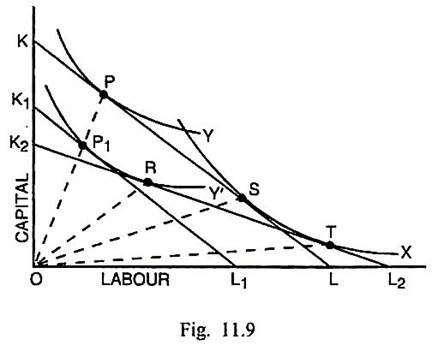
The impact of neutral technical progress in the export industry producing capital-intensive commodity Y upon the capital-labour ratio, factor and commodity prices, output and terms of trade is explained through Figs. 11.9 and 11.10.
ADVERTISEMENTS:
In Fig. 11.9, labour is measured along the horizontal scale and capital along the vertical scale. X is the labour-intensive importable commodity and Y is capital-intensive exportable commodity. Originally KL is the factor price line and isoquant X of commodity X and isoquant Y of commodity Y are tangent to this factor price line at S and P respectively. The K-L ratio at P is measured by the slope of line OP and K-L ratio at S is measured by the slope of line OS.
If there is neutral technical progress in the export industry Y, the isoquant of Y shifts to Y’. Given the same factor prices, tangency between K1L1 (parallel to KL) and Y’ takes place at P1 where K-L ratio, measured by the slope of line OP1, remains the same as at P. But at P1 the marginal productivity of both the factors has increased. The producers in this industry will bid at constant factor prices for more quantities of the factors.
Since commodity Y is capital-intensive, there is particularly greater demand for capital. It will result in a rise in the price of capital relative to labour so that new factor price line is K2L2. It becomes tangent to Y’ at R and X at T. The K-L ratio at R is measured by the slope of line OR. Since OR is less steep than OP1, there is a decrease in K-L ratio in the production of Y. In case of X commodity also K-L ratio at T, measured by the slope of line OT, is less than this ratio at S. It means the methods of production have become more labour-intensive in both industries.
ADVERTISEMENTS:
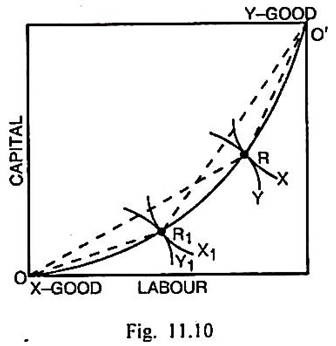
How the technical progress will affect the level of output is explained through Fig. 11.10. In this box diagram, O is the origin for good X and O’ is the origin for good Y. 00′ is the non-linear contract curve. X being a labour-intensive good, the contract curve goes below the diagonal. Originally the equilibrium is at R where isoquants X and Y concerning the two commodities are tangent to each other. The K-L ratio in X commodity at R is measured by the slope of the line OR. The K-L ratio in Y commodity at R is measured by the slope of line O’R.
As technical progress occurs in industry Y, its isoquant shifts to the left to a higher position at Y1. It becomes tangent to isoquant X1 of the good X. Thus after neutral technical progress takes place, the equilibrium point occurs at R1. The K-L ratio at R1 in X and Y commodities is measured by the slopes of the lines OR1 and O’R1 respectively. Since OR1 is less steep than OR and O’R1 is less steep than O’R, the production of Y commodity (export good) increases from O’R to OR, whereas the production of X commodity (import- competing good) decreases from OR to OR1 subsequent to technical progress in industry Y.
The relative shortage of X commodity and increased output of Y commodity will push up the price of X commodity and lower the price of Y commodity. As the price of export good Y falls relative to that of import-competing good X, there will be deterioration in the terms of trade for this country. On the opposite, if technical progress takes place in the import-competing industry, there will be an improvement in the terms of trade of the country.
The extent to which terms of trade will be favourable or unfavourable subsequent to neutral technical progress depends upon the magnitude of income elasticity of demand for importable. The lower the value of income elasticity of demand for importable, less is the deterioration in the terms of trade in the unfavourable case and more the improvement in the favourable case.
2. Labour-Saving Technical Progress and Trade:
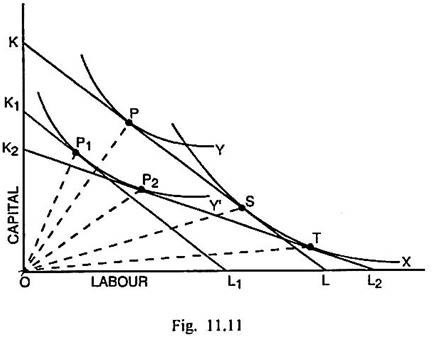
If the labour-saving technical progress takes place in capital-intensive export industry, the effects on terms of trade of the country are not clear-cut. These are rather indeterminate. The effects of such technical progress on capital intensity, factor and commodity prices, output and terms of trade are explained through Figs. 11.1 Land 11.12.
ADVERTISEMENTS:
In Fig. 11.11, the isoquant Y is related to the capital-intensive export good Y and isoquant X is related to import-competing commodity X. Given the factor price line KL, the equilibrium occurs in respect of the production of X and Y commodities at P and S respectively. The K-L ratio in Y commodity at P is measured by the slope of line OP and it is measured in case of X commodity by the slope of the line OS. As technical innovations take place in industry Y, the isoquant shifts from Y to Y’. If the factor prices remain the same, the new factor price line is K1L1 which is tangent to Y’ at P1.
Since the K-L ratio at P1 is measured by a more steep line OP1, it follows that K-L ratio in the production of Y commodity has increased. The technical progress can either be capital-using and labour-saving. If the commodity prices remain unchanged, greater use of capital in the capital-intensive industry will increase the price of capital. On the other hand, the technical progress being labour-saving, the demand for labour gets reduced and price of labour
tends to fall.
As a result, the new factor price line is K2L2. It is tangent to Y’ at P2 where the K-L ratio is measured by the slope of the line OP2. It signifies that the K-L ratio is lower than in the original position. In case of commodity X, however, the capital-labour ratio falls because the line OT is less steep than OS. Had the price of capital increased relative to labour by a larger measure than shown through the line K2L2, the technical progress would have led to a fall in K-L ratio compared with the original situation in Y commodity. This possibility can arise because the labour has become relatively much cheaper and producers can employ labour- intensive methods both in the production of X and Y commodities.
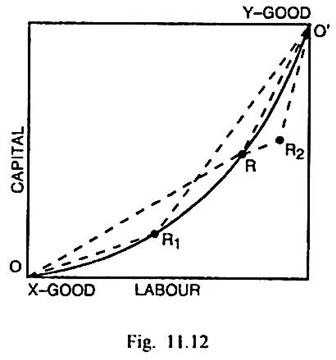
As regards the effects on production, the box diagram 11.12 shows that O is the origin of good X and O’ is the origin of export good Y which is capital-intensive. OO’ is the non-linear contract curve bulging down. Originally production takes place at R where the K-L ratios in X and Y commodities are measured by the slopes of the lines OR and O’R respectively. If technical progress takes place in industry Y the point of production shifts to R1 where the K-L ratio in X is measured by the slopes of OR1 and in Y by the slope of the line O’R1. The K-L ratio falls in case of both the commodities signifying that lines of production in both the industries can become labour-intensive.
ADVERTISEMENTS:
The implication concerning output of two commodities is clear. Since the length of the line O’R1 is more than of O’R, the production of Y commodity has increased. At the same time the length of line OR1 is less than of OR, the production of commodity X has fallen. In this situation, the price of export good Y is likely to fall and that of X is likely to rise. Consequently, the terms of trade are likely to deteriorate. Had the technical progress taken place in the import-competing commodity Y, the terms of trade would have got improved.
The labour-saving technical progress in the capital-intensive industry can have some other implications for output and terms of trade. If the technical-progress leaves K-L ratio in X commodity unchanged as at point R2 and causes a rise in K-L ratio in Y commodity, there is an increased output of X. The output of Y is lower at R2. Such a situation will result in higher price of the export good Y and a lower price of X so that the terms of trade become favourable to this country.
It, therefore, suggests that the labour-saving innovation in the capital-intensive export industry can have any effect on output and relative prices and the impact of such technical progress on terms of trade may be indeterminate.
3. Capital-Saving Technical Progress and Trade:
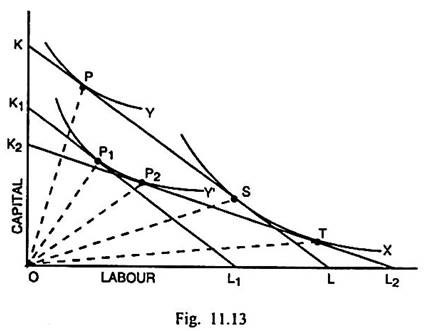
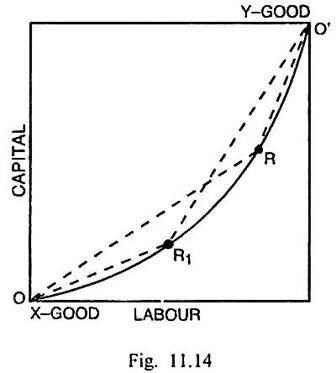
A process of capital-saving technical progress in the capital-intensive export industry is likely to result in the worsening of the terms of trade. The effects of such technical progress upon capital- intensity, factor and commodity prices, output and terms of trade are explained through Figs. 11.13 and 11.14.
In Fig. 11.13, given the prices of capital and labour, KL is the factor price line which is tangent to the isoquant X of import-competing good X at S and to the isoquant Y of capital-intensive export good Y at P. The K-L ratios at P and S are measured by the slopes of the lines OP and OS respectively.
ADVERTISEMENTS:
As capital-saving innovations take place in the export-industry Y, assuming factor prices to remain unchanged, the factor price line shifts to K1L1 but it is parallel to KL. K1L1 is tangent to the isoquant Y’ at P1. Y’ has undergone shift due to technical progress. The K-L ratio of P1 is measured by the slope of the line OP1.
Since OP1 is less steep than OP, there is a fall in K-L ratio in the production of Y commodity. If the commodity prices remain unchanged, the factor prices must change in favour of capital. Consequently, the new factor price line is K2L2. It is tangent to Y’ at P2 and to X at T. The K-L ratios at P2 and T are less when compared with the original positions P and S respectively. It means the techniques of production become more and more labour-intensive in both the industries.
The effects on production are studied through Fig. 11.14. Given the non-linear contract curve OO’ bulging down, production originally takes place at R. The K-L ratios in X and Y commodities at R are measured through the slopes of lines OR and O’R respectively. The lengths of these lines indicate production of respective commodities before technical progress. As there are capital-saving innovations in the export industry Y, production takes place at R1. The K-L ratios in X and Y commodities at R1 are measured through the slopes of the lines OR1 and O’R1 respectively.
At this point, K-L ratios have decreased in case of both the products. It means the techniques have become more labour-intensive in both the industries. The production of X and Y commodities at R1 is measured by the lengths of the lines OR1 and O’R1 respectively. Fig. 11.14 shows that the production of Y has increased and that of X has fallen. Such a situation will cause a fall in the price of X whereas the price of Y will rise.
Consequently, the terms of trade get deteriorated for this country. If the technical progress had taken place in the import-competing industry X, the terms of trade would have become favourable to this country.
To sum up, a neutral technical progress in the export sector will cause deterioration in the terms of trade. There will be improvement in the terms of trade, if neutral technical progress takes place in the import-competing sector. In case the technical progress is capital-saving and it takes place in the capital-intensive export sector, there is worsening of the terms of trade.
ADVERTISEMENTS:
When the labour-saving technical progress occurs in the capital-intensive export sector or capital-saving technical progress in labour-intensive import-competing sector, there can be possibilities of worsening or improvement in the terms of trade. In such a situation, the impact of such a technical progress can be considered indeterminate.

