Let us make an in-depth study of the IS-Curve. After reading this article you will learn about: 1. Derivation of the IS Curve 2. Factors Determining the Slope of the IS Curve.
Derivation of the IS Curve:
The equilibrium condition in the goods market in terms of income expenditure approach is
Y = C + I + G … (5)
In terms of the leakage-injection approach the condition is
ADVERTISEMENTS:
I + G = S + T … (6)
If we ignore the government sector (i.e., if G and T are zero), we can express equation (6) as
I(r) = S(Y) … (7)
Here investment is assumed to depend on r and S on Y.
ADVERTISEMENTS:
We construct the IS curve to find combinations of r and Y that equate I with S.
While deriving the IS curve we have to remember three points:
1. If the r falls, I increases.
2. If I increases, Y increases through the multiplier. Y has to increase to ensure that sufficient saving is generated to balance the new level of investment.
ADVERTISEMENTS:
3. So there is an inverse relation between r and Y.
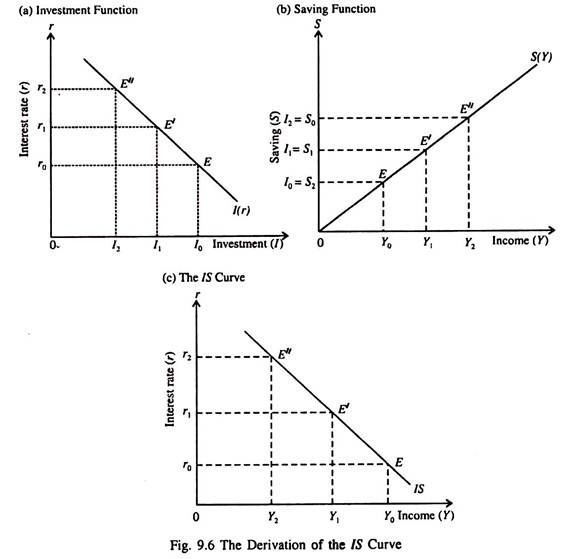
Fig. 9.6 shows how the IS curve is derived. In part (a), at interest rates r0, r1 and r2, the levels of investment will be I0, I1, and l2. In part (b) we see that to generate equivalent levels of saving S0, S1, and S2, income has to rise from Y0 to Y1, and Y2 respectively.
In part (c) we show alternative combinations of r and Y which bring about commodity market equilibrium; that is to say ensure that I = S. The locus of points E, E, and E” is the IS curve in part (1) showing the complete set of combinations of Y and r levels that equilibrate the product market.
The IS curve is defined as a locus of points showing alternative combinations of Y and r such as (r0, y0), (r1, y1), (r2, y2) which ensure commodity (product) market equilibrium.
Any point on the IS curve implies product market equilibrium because at each such point I = S. i.e., desired S = desired I — which is the equilibrium condition of national income in the simple Keynesian model, Thus the IS curve is investment-saving curve. Since there is an inverse relation between r and Y the IS curve is downward sloping from left to right. In other words, the IS curve has a negative slope.
Factors Determining the Slope of the IS Curve:
It is not enough to know that the IS curve is negatively sloped. It may be steep or flat. The steepness of the curve is of considerable interest to us because it is a factor determining the relative effectiveness of stabilisation policies, viz., monetary and fiscal policies.
The steepness of the IS curve depends on two things:
ADVERTISEMENTS:
(i) Interest elasticity of investment
(ii) MPS, i.e., the slope of saving curve.
1. Interest elasticity of investment:
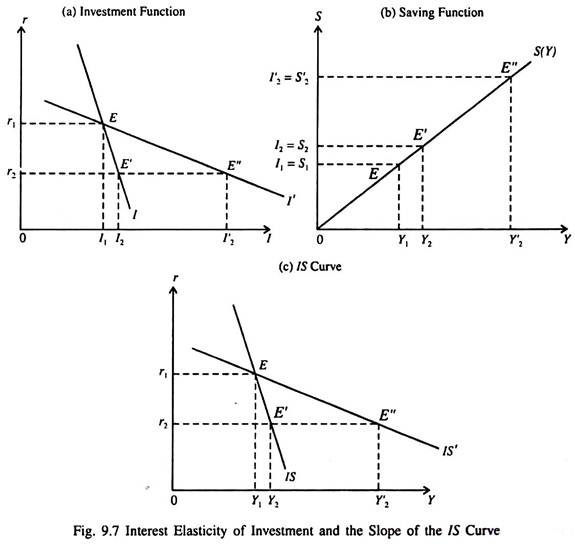
If the interest elasticity of investment is high, a small drop in r will lead to a large increase in I and a correspondingly large increase in Y (through the investment multiplier).
ADVERTISEMENTS:
This point is illustrated in Fig. 9.7. In part (a) when the investment (demand) curve is steep (I), a fall in r will increase I by only a small amount. In part (b) therefore, an increase in saving and, hence, income is needed to restore equilibrium in the commodity market.
So the IS curve in part c (IS) is steep. If the investment curve is relatively flat, investment will increase by a much larger in respond to a fall in r. Thus increase is saving and income has to be much larger than in the first case. In this case the IS curve will be relatively flat (such as IS’).
ADVERTISEMENTS:
2. The slope of the saving curve:
The slope of the IS curve also depends on the saving function whose slope is MPS. The higher the MPS, the steeper is the IS curve. For a given fall in the interest rate, the amount by which income would have to be increased to restore equilibrium in the product market is smaller (larger), the higher (lower) the MPS.
If the MPS is relatively high, then a small increase in income is necessary to generate the new saving (required to support new investment caused by a fall in the rate of interest) than if the MPS were low.
i. Factors that Shift the IS Curve:
To analyse the causes and effects of shift of the IS curve we have to incorporate government expenditure and taxes in our analysis. The IS curve will shift if any or all of the components of autonomous expenditure T, I and G change.
Now the condition of product market equilibrium given by equation (6) becomes
ADVERTISEMENTS:
I(r) + G = S (Y – T) + T … (8)
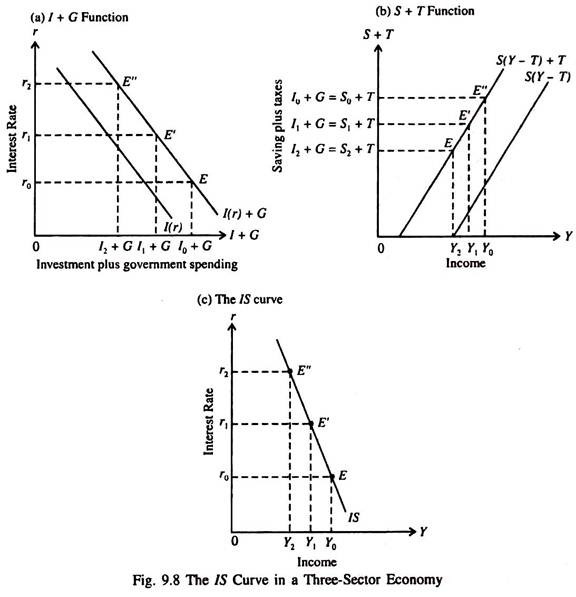
Fig. 9.8 shows the derivation of the IS curve in the three-sector model including the government. In part (a), investment plus government expenditure must be equal to I1 + G. Therefore, equilibrium in the goods market requires that saving plus taxes, as shown in part (b), equal S1, + T (= I1 + G), at the income level Y1.
Thus the combination (r1, Y1) is one point (E’) along the IS curve in Fig. 9.8(b). Similarly, interest rate r0 will require income level Y0 for equilibrium in the product market (point E in Fig. 9.8c). By proceeding this way we derive the IS curve which is a locus of all combinations of Y and r which equilibrate the goods market.
The equilibrium condition given by equation (8) shows that a change in either G or T will shift the IS curve and disturb an initial product market equilibrium position. In addition, any autonomous (income-independent) change which shifts the investment function will shift the IS curve. It may be noted that, in general all the factors that determine autonomous expenditures in the SKM will shift the IS curve.


