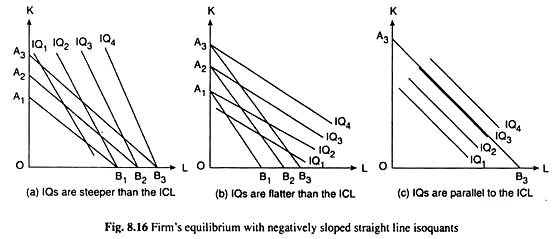
If the production function of the firm is such that it gives rise to negatively sloped straight line isoquants (IQs), then the question of equilibrium at the point of tangency does not arise, since two straight lines—the IQ and the ICL—cannot be tangent to each other, they can only cut or coincide.
In this case, if the IQs are steeper than the ICL, the firm’s constrained output maximisation or cost minimisation would occur at the corner of the ICL with the horizontal axis and if the IQs are flatter than the ICL, the firm’s equilibrium would occur at the other corner of the ICL with the vertical axis.
However, if the IQs and ICL happen to have the same slope, one of the IQs would coincide with the ICL and the firm would be in equilibrium at any point on this IQ. We may explain this with the help of Fig. 8.16. In Fig. 8.16(a), the IQs are steeper than the parallel ICLs, viz., A1B1, A2B2, etc.
Let us suppose that, initially, the ICL, A1B1, represents the cost constraint. Then the corner point B1 of the ICL would take the firm to the highest possible IQ, viz., IQ2, i.e., to the maximum possible level of output subject to the cost constraint.
ADVERTISEMENTS:
At the point B1, the firm uses only one of the inputs, viz., labour (L) for producing its output. If the firm wants to expand and increase its cost level from A1B1 to A2B2, its output-maximising equilibrium point now would be the corner point B2 of the line A2B2. The firm’s output level now would be higher—it would be the one represented by IQ3.
In the same way, if the firm’s cost level increases further and its ICL becomes the line A3B3 which is higher than A2B2, the firm’s equilibrium point would move from B2 to B3 and its output would be that of the higher IQ1 viz., IQ4.
From what we have obtained, it follows that as the firm decides to expand by increasing its level of cost, its equilibrium point would move from the point B1 to B2 to B3, etc., i.e., here in the case of IQs being steeper straight lines than the ICLs, the firm’s expansion path would be obtained by connecting the points O, B1, B2, B3, etc.
Therefore, the expansion path in this case would be the horizontal axis itself along which the quantity used of labour (L) is measured.
In Fig. 8.16(b), we have depicted the case where the IQs are negatively sloped straight lines as also the ICLs, but here the ICLs are steeper than the IQs, and, therefore, the firm’s output maximisation subject to the cost constraint would occur at the corner point of the ICL with the vertical axis.
Otherwise, this case is more or less the same as the previous case. Since the equilibrium occurs here at the corners A1, A2, A3, etc., the firm’s expansion path in this case would be the vertical axis along which quantity of capital (K) is measured—it would be obtained by connecting the points O, A1, A2, A3, etc.
Lastly, let us come to Fig. 8.16(c). Here the straight line ICLs and IQs are all parallel, and so, if the cost constraint or a particular ICL is given, then there would be obtained an IQ that would coincide with this ICL. For example, in Fig. 8.16(c), the cost constraint is given by, say, the ICL, A3B3, and an IQ1 viz., IQ3 has coincided with this ICL.
So here IQ3 is the highest possible IQ that the firm can reach given the cost level A3B3, and any point on IQ3 may be the firm’s equilibrium point. Therefore, no unique equilibrium point would be obtained in this case. Since, subject to any cost constraint, equilibrium is not uniquely obtained, the expansion path in this case would not be uniquely obtained.
