Get the answer of: What is Isoquant and Isocost Line in Production Theory?
A firm’s bank objective is profit maximisation. If, in the short run, its total output remains fixed (due to capacity constraint) and if it is a price-taker (i.e., cannot fix the price or change price on its own as in a purely competitive market) its total revenue will also remain fixed. Therefore, the only way to maximise profit is to minimise cost. Thus, profit maximisation and cost minimisation are the two sides of the same coin.
Moreover, supply depends on cost of production. The decision to supply an extra unit depends on the marginal cost of producing that unit. Perhaps the most important determinant of the firm’s price-output decision in any market is its cost of production.
The firm’s cost, in its turn, depends on two key factors, viz.:
ADVERTISEMENTS:
(1) The technical relation between inputs and output (i.e., how outputs vary as inputs vary), and
(2) Factor prices (i.e., the price of labour or the wages, the price of capital or the interest rate and so on).
The long-run production function of a firm involving the usage of two factors, say, capital and labour is represented by equal-product curve or isoquant. This curve is also known as a producer’s indifference curve. An isoquant traces out the combinations of any two inputs which yield the same level of output.
This combinations must be the most efficient ones — i.e., any point on an isoquant shows the minimum quantities of the inputs required to produce a given output. Isoquants are typically drawn as being convex to the origin because of the assumed substitutability of inputs.
ADVERTISEMENTS:
Isoquants:
An isoquant is a locus of points showing all the technically efficient ways of combining factors of production to produce a fixed level of output. It is also known as the equal product curve. In case of two variable factors, labour and capital, an isoquant appears as a curve on a graph the axes of which measure quantities of the two factors. The curve shows the efficient alternative techniques of production or alternative combinations of two factors that can produce a fixed level of output.
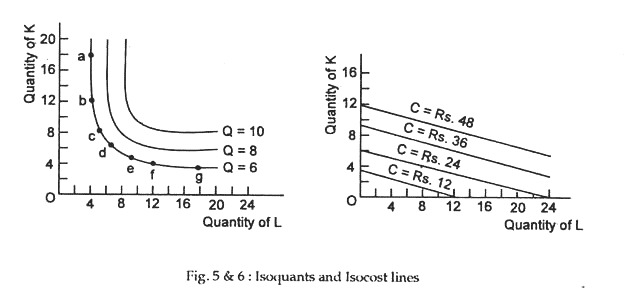
Table 1 illustrates, by using hypothetical numbers, seven alternative methods of producing six units of output. These alternatives are shown also in Fig. 5, as represented by the curve Q = 6. Thus, the firm could choose combination a (18K + 2L), combination g (2K + 18L) or any other combination shown in Table 1.
Fig. 5 shows two other isoquants, each corresponding to particular (fixed) level of output, viz., Q = 8 and Q = 10. Each curve shows the alternative combinations of labour and capital that would produce 8 and 10 units of output, respectively. We could draw as many isoquants as we like.
Isocost Lines:
An isoquant shows what a firm is desirous of producing. But, the desire to produce a commodity is not enough. The producer must have sufficient capacity to buy necessary factor inputs to be able to reach its desired production level. The capacity of the producer is shown by his monetary resources, i.e., his cost outlay (or how much money he is capable of spending) on capital and labour, the prices of which are taken as constant, i.e.’, given in the market place.
So, like the consumer the producer has also to operate under a budget (resource) constraint. This is picturised by his budget line called isocost line. To find the least cost combination of inputs to produce a given output, we need to construct such equal cost lines or isocost lines.
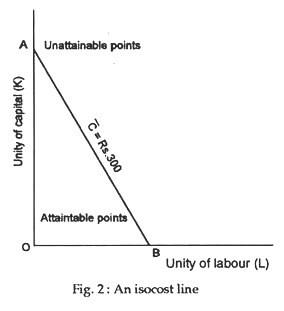
An isocost line is a locus of points showing the alternative combinations of factors that can be purchased with a fixed amount of money. In fact, every point on a given isocost line represents the same total cost. To construct isocost lines we need information about the market prices of the two factors. For example, suppose, the price of labour is Re. 1 per unit and the price of capital is Rs. 4 per unit.
Then an outlay of Rs. 36 could buy 9K + 0L, 36L + 0K, or other combinations such as 5K + 16L. All these and other various combinations are shown in Fig. 2 by isocost line C = Rs. 36. Isocost lines C = Rs. 12, C = Rs. 24 and C = Rs. 48 show the alternative combinations of capital and labour that can be purchased or hired by spending Rs. 12, Rs. 24 and Rs. 48, respectively.
These lines are straight lines because factor prices are constant and they have a negative slope equal to the factor-price ratio, i.e., the ratio of labour price to capital price (i.e., the wage ratio -5- the rate of interest).
Cost Minimisation:
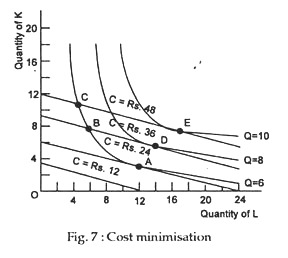
Here, the firm seeks to minimise its cost of producing a given level of output. To find the least-cost combination of factors for fixed level of output we combine Fig. 5 and Fig. 6 in Fig. 7. Suppose, the producer wants to produce six units of output. He could do so using the combination represented by points A, B or C in Fig. 3.
For example, the cost would be Rs. 48 at C, Rs. 36 at B and Rs. 24 at A. The cheapest method is at A, where the isoquant for output of six (Q = 6) is tangent to an isocost line (C = Rs. 24). In Fig. 3 the firm tries to find out the least expensive factor combination along its isoquant. It looks for that factor combination that is on the lowest of the isocost lines. Where the isoquant touches (but does not cross) the lowest isocost line is the least cost position.
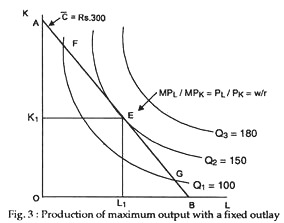
The tangency point shows that optimisation in production is reached when factor prices and marginal product are proportional, with equalised marginal product per rupee. The minimum-cost points are A, D and E. Each such point shows the equilibrium factor combination for maximising output subject to cost constraint, i.e., subject to fixed factor prices and fixed outlay (on resources).
We may now speak a few words about the slopes of isoquant and an isocost line. The slope of an isoquant gives the marginal rate of technical substitution (MKTS) defined as the increase in the quantity of one factor that is required to replace a unit decrease in another factor, when output is held constant along any isoquant. It is also known as the desired rate of factor substitution, i.e., the rate at which the producer wants to substitute one factor by the other.
MKTS is, in fact, the ratio of the marginal products of the factors. To see this, consider an example. Assume that output is such that the MPL and the MPK are both equal to 2 (units of output), i.e., MPK = MPL. If the firm is to maintain the same level of output while reducing capital by one unit, it needs to replace one unit of capital by one unit of labour. If at another point on the same isoquant, the MPL = 2, while the MPK = 1, the firm needs to replace a unit of capital with only half unit of labour.
ADVERTISEMENTS:
An isocost line shows the alternative quantities of two factors viz., capital and labour that can be purchased or hired with a fixed sum of money. Its slope is given by the ratio of the prices of the two factors. It is known as the actual rate of factor substitution, the rate at which the firm can substitute labour by capital in the market place.
Thus, in Fig. 3, given the prices of labour and capital at Re 1 and Rs. 4 per unit, respectively, the slope of C = Rs. 12 is determined by drawing the line joining points 3K + 0L (which represents outlay of Rs. 12 entirely on capital) and 12L + OK (Rs. 12 spent entirely on labour). All the isocost lines in the diagram have the same slope because the relative prices of labour and capital are the same. If labour were relatively more expensive, the isocost lines would be steeper in Fig. 2.
ADVERTISEMENTS:
Conclusion:
Cost minimisation occurs when an isoquant is just tangent to (but does not cross) an isocost line. When this happens the ratio of the prices of factors is the same as the ratio of their marginal products. Symbolically
MPL/MPK = PL/PK


