Law of supply expresses a relationship between the supply and price of a product. It states a direct relationship between the price of a product and its supply, while other factors are kept constant.
For example, in case the price of a product increases, sellers would prefer to increase the production of the product to earn high profits, which would automatically lead to increase in supply.
Similarly, if the price of the product decreases, the supplier would decrease the supply of the product in market as he/she would wait for rise in the price of the product in future.
The statement given for the law of supply is as follows:
ADVERTISEMENTS:
“Other things remaining unchanged, the supply of a commodity expands with a rise in its price and contracts with a fall in its price.”
The law of supply can be better understood with the help of supply schedule, supply curve, and supply function. Let us discuss these concepts in detail in the next sections.
Supply Schedule:
Supply schedule shows a tabular representation of law of supply. It presents the different quantities of a product that a seller is willing to sell at different price levels of that product.
ADVERTISEMENTS:
A supply schedule can be of two types, which are as follows:
i. Individual Supply Schedule:
Refers to a supply schedule that represents the different quantities of a product supplied by an individual seller at different prices.
Table-8 shows the supply schedule for the different quantities of milk supplied in the market at different prices:
ii. Market Supply Schedule:
Refers to a supply schedule that represents the different quantities of a product that all the suppliers in the market are willing to supply at different prices. Market supply schedule can be drawn by aggregating the individual supply schedules of all individual suppliers in the market.
Table-9 shows the market supply schedule of a product supplied by three suppliers. A, B, and C:
Supply Curve:
The graphical representation of supply schedule is called supply curve. In a graph, price of a product is represented on Y-axis and quantity supplied is represented on X-axis. Supply curve can be of two types, individual supply curve and market supply curve. Individual supply curve is the graphical representation of individual supply schedule, whereas market supply curve is the representation of market supply schedule.
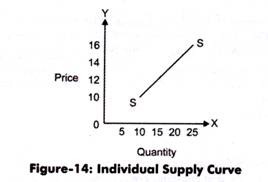
Figure-14 shows the individual supply curve for the individual supply schedule (represented in Table-8):
In Figure-14, the supply curve is showing a straight line and an upward slope. This implies that the supply of a product increases with increase in the price of a product.
ADVERTISEMENTS:
Figure-15 shows the market supply curve of market supply schedule (represented in Table-9):
The slope of market supply curve can be obtained by calculating the supply of the slopes of individual supply curves. Market supply curve also represents the direct relationship between the quantity supplied and price of a product.
Supply Function:
ADVERTISEMENTS:
Supply function is the mathematical expression of law of supply. In other words, supply function quantifies the relationship between quantity supplied and price of a product, while keeping the other factors at constant. The law of supply expresses the nature of relationship between quantity supplied and price of a product, while the supply function measures that relationship.
The supply function can be expressed as:
Sx = f (Px)
Where:
ADVERTISEMENTS:
Sx = Quantity supplied for product X
Px = Price of product X
f = Constant representing change produced in Sx with one unit change in Px
Assumptions in Law of Supply:
The law of supply expresses the change in supply with relation to change in price. In other words the main assumption of law of supply is that it studies the effect of price on supply of a product, while keeping other determinants of supply at constant.
Apart from this, there are certain assumptions that are necessary for the application of law of supply, which are as follows:
ADVERTISEMENTS:
i. Assumes that the price of a product changes, but the change in the cost of production is constant. This is because if the cost of production rises with increase in price, then sellers would not supply more due to the reduction in their profit margin. Therefore, law of supply would be applicable only when the cost of production remains constant.
ii. Assumes that there is no change in the technique of production. This is because the advanced technique would reduce the cost of production and make the seller supply more at a lower price.
iii. Assumes that there is no change in the scale of production. This is because if the scale of production changes with a period of time, then it would affect the supply. In such a case, the law of supply would not be applicable.
iv. Assumes that the policies of the government remain constant. If there is an increase in tax rates, then the supply of product would decrease even at the higher price. Therefore, for the application of law of supply, it is necessary that government policies should remain constant.
v. Assumes that the transportation cost remain the same. In case the transportation cost reduces, then the supply would increase, which is invalid according to the law of supply.
vi. Assumes that there is no speculation about prices in future, which otherwise can affect the supply of a product. If there is no speculation about products, then the economy is assumed to be at balance and people are satisfied with the available products and do not require any change.
ADVERTISEMENTS:
Exception to Law of Supply:
According to the law of supply, if the price of a product rises, then the supply of the product also rises and vice versa. However, there are certain conditions where the law of supply is not applicable. These conditions are known as exceptions to law of supply. In such cases, the supply of a product falls with the increase in price of a product at a particular point of time.
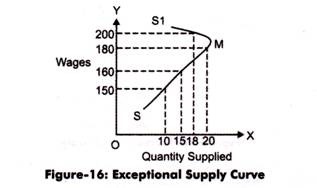
For example, there would be decrease in the supply of labor in an organization when the rate of wages is high. The exception of law of supply is represented on the regressive supply cure or backward sloping curve. It is also known as exceptional supply curve, which is shown in Figure-16:
In Figure-16, SMS1 is the exceptional supply curve for labor. In this case, wages are regarded as the price of labor. It can be interpreted from the graph that as the wages of a worker increases, its quantity supplied that is working hours decreases, which is an exception to the law of supply.
Some of the exceptions of law of supply are as follows:
ADVERTISEMENTS:
i. Speculation:
Refers to the fact that the supply of a product decreases instead of increasing in present when there is an expected increase in the price of the product. In such a case, sellers would not supply the whole quantity of the product and would wait for the increase in price in future to earn high profits. This case is an exception to law of demand.
ii. Agricultural Products:
Imply that law of supply is not valid in case of agricultural products as the supply of these products depends on particular seasons or climatic conditions. Thus, the supply of these products cannot be increased after a certain limit in spite of rise in their prices.
iii. Changes in Other Situations:
Refers to the fact that law of supply ignores other factors (except price) that can influence the supply of a product. These factors can be natural factors, transportation conditions, and government policies.


