Learn this article to learn how to Derive the Saving Function from the Consumption Function!
Saving function can be derived from the consumption function.
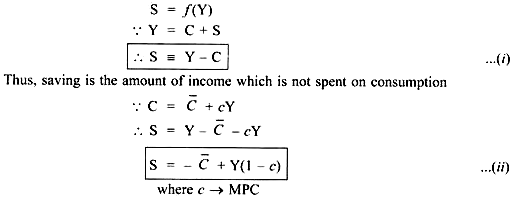
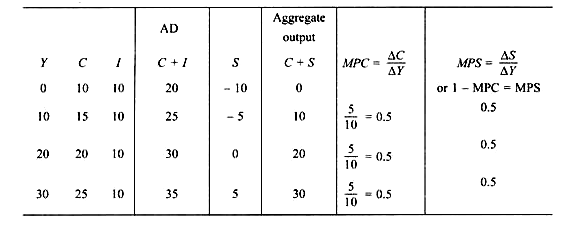
As change in income is devoted either to a change in consumption or a change in saving or to both, therefore, the two ratios, that is,
ADVERTISEMENTS:
∆C/∆Y and ∆S/∆Y should add up to 1.
MPC + MPS = 1
or 1 – MPC = MPS or (1 – c) is the MPS
Where MPC represents the slope of consumption curve and MPS (1 – c) represents the slope of saving curve.
ADVERTISEMENTS:
As MPS is positive, therefore, saving is an increasing function of the income level, i.e., saving increases with increase in income.
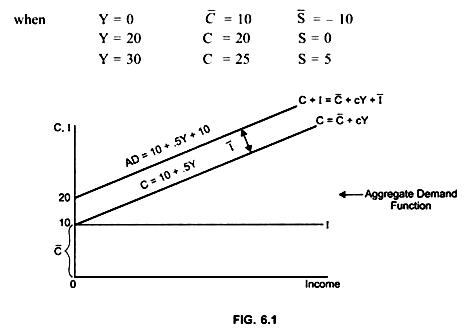
1. Keynes has assumed investment as autonomous, that is, independent of income level, therefore the investment curve is horizontal straight line parallel to X-axis, (Fig. 6.1).
ADVERTISEMENTS:
2. As consumption is directly related to the income level, therefore consumption curve is positively sloped. C = f(Y) (Fig. 6.1).
3. AD curve (C + I) is positively sloped. The gap between the consumption curve and AD curve is constant, that is, the two curves are parallel because Investment is constant (Fig. 6.1).
4. Saving curve is positively sloped because saving is directly related to the income level. S = f(Y) (Fig. 6.2).
At very low income level there is dissaving. Dissaving implies that consumption is greater than the income level. This increased consumption is met from past savings, therefore, there will be dissaving in the economy,
e.g. Y = 10
C = 15
... Y = C + S
... S = 10- 15
ADVERTISEMENTS:
Or, S = -5 → Dissaving (Fig. 6.2).
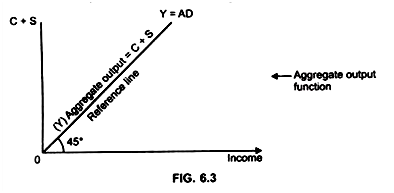
5. 45° line shows that at all points desired consumption is equal to the income level. It is also called reference line because it helps to locate the break even level of income at which Y = C (Fig, 6.3).


