In this section we shall examine the case of a monopolist who produces a homogeneous product in different plants.
We shall restrict the analysis to two plants for simplicity. However, the analysis may easily be generalized to any number of plants.
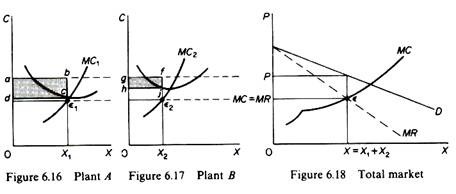
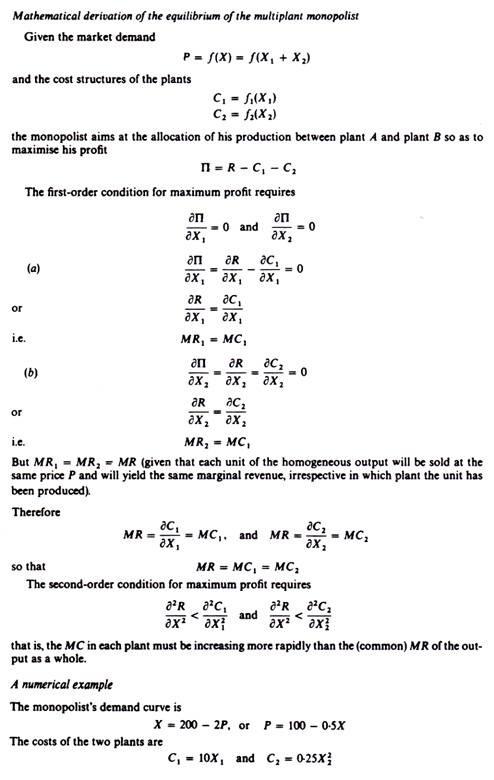
Assume that the monopolist operates two plants, A and B, each with a different cost structure (Figures 6.16 and 6.17).
He has to make two decisions:
ADVERTISEMENTS:
Firstly, how much output to produce altogether and at what price to sell it so as to maximize profit.
Secondly, how to allocate the production of the optimal (profit-maximizing) output between the two plants.
The monopolist is assumed to know his market demand (and the corresponding MR curve) and the cost structure of the different plants. The total MC curve of the monopolist may be computed from the horizontal summation of the MC curves of the individual plants
MC = MC1 + MC2
ADVERTISEMENTS:
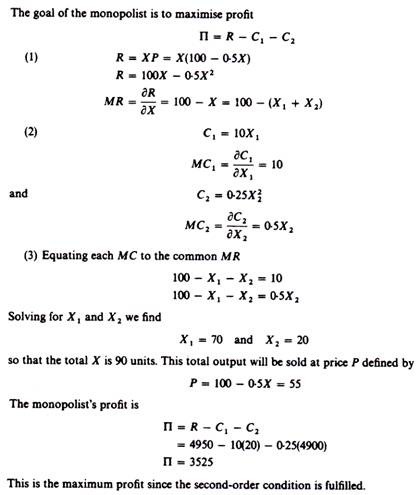
Given the MR and MC curves, the monopolist can define the total output and the price at which it must be sold in order to maximize his profit from the intersection of these two curves (point ɛ in figure 6.18).
The allocation of production between the plants is decided by the marginalistic rule
MC1 = MC2 = MR
ADVERTISEMENTS:
In other words, the monopolist maximizes his profit by utilizing each plant up to the level at which the marginal costs are equal to each other and to the common marginal revenue. This is because if the MC in one plant, say plant A, is lower than the marginal cost of plant B, the monopolist would increase his profit by increasing the production in A and decreasing it in B, until the condition is fulfilled.
MC1 = MC2 = MR
Graphically the equilibrium of the multiplant monopolist may be defined as follows. The total profit-maximizing output and its price is defined by the intersection of MC and MR curves (point ε in figure 6.18). From the point of intersection we draw a line, parallel to the X axis, until it intersects the individual MC1 and MC2 curves of the two plants. At these points the equilibrium condition (MC = MR= MC1 = MC2) is satisfied. If from these points (ε1 andε2) we draw perpendiculars to the X-axis of figures 6.16 and 6.17, we find the level of output that will be produced in each plant. Clearly X1 + X2 must be equal to the profit-maximising output X. The total profit is the sum of profits from the products of the two plants. The profit from plant A is the shaded area abed and the profit from plant B is the shaded area gfjh.


