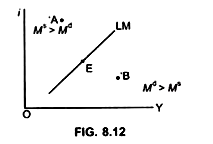
The LM curve shows all combinations of interest rates and income levels at which the money market clears.
The money market clears where demand for real balances is equal to the supply of real balances, that is,
Where:
Demand for money = Supply of money
ADVERTISEMENTS:
Demand for Money:
According to Keynes: Money is demanded for three motives:
(i) Transaction motive
(ii) Precautionary motive
ADVERTISEMENTS:
(iii) Speculative motive.
The Keynesian theory of demand for money makes the transaction demand (and precautionary demand) a direct function of income level
Where k, h → Sensitivity of demand for real balances to the level of income and interest rate respectively.
ADVERTISEMENTS:
Equation (ix) shows that the demand for real money balances, depends on:
(i) Level of real income:
demand for money depends on the level of income (real income) because people hold money to purchase goods and services. Higher is the level of income, greater will be the demand for real balances. It is also known as transaction demand for money (L1).
If price level increases the purchasing power of money decreases, therefore, people will have to hold more nominal balances to purchase the same quantity of goods.
(ii) Rate of interest:
It is the opportunity cost of holding money because when people hold money they forgo the interest rate which they could have earned by lending the money to someone else. When interest rate increases, it becomes more costly to hold money.
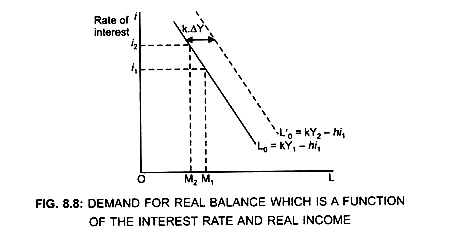
As a result people will hold less of wealth in the form of money at each income level. This is also known as speculative demand for money (L2). The equation (ix) shows that for a given income level the demand for real balances (L2) is a decreasing function of the interest rate. Therefore, demand curve for real balances is negatively sloped. (Fig. 8.8).
Thus demand for real balances (L) increases with increase in level of real income and decreases with interest rate.
Fig. (8.8) shows that when interest increases from i1 to i2, demand for real balances decreases from M1 to M2 at a given (same) income level Y1. But when income increases from Y1 to Y2, at each interest rate the demand for real balance increases.
ADVERTISEMENTS:
As a result, the demand for money curve will shift to the right from L0 to L’0.
The shift in the curve = k.∆Y
The Supply of Money/Supply of Real Balances:
ADVERTISEMENTS:
The supply of money is determined outside the model. It is exogenous. The nominal stock of money (M) is determined by the monetary authorities, with price level assumed to be constant at the level (P).
Therefore, the real money supply in the economy which is given by M/P is held constant at the level (M/P)
As both (M) and (P) has been taken as exogenous variable, therefore, real money supply (M/P) does not depend on the interest rate.
ADVERTISEMENTS:
Equilibrium in the Money Market:
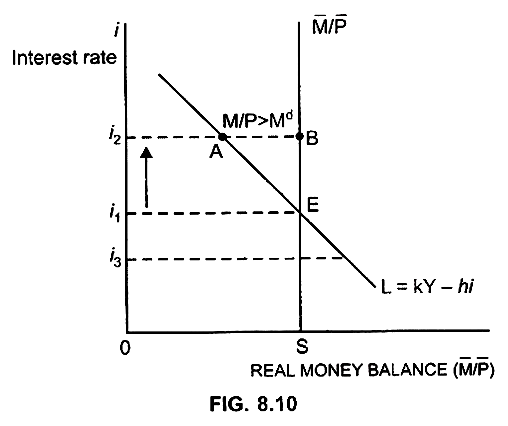
The money market is in equilibrium at point E, as here, demand for real balance (L = kY – hi) is equal to the supply of real balance (M/P).
... Equilibrium Interest rate is → i1
If interest rate increases from i1 to i2
Supply of real balance (i2B) will be greater than the demand for real balances (i2A)
ADVERTISEMENTS:
i2B > i2 A
The individuals will therefore have excess supply of money and so they will convert some of their non-interest bearing money into interest bearing bank deposits or bonds,that is, they will purchase bonds. As a result, price of bonds will increase. As the price of bonds and interest rate are inversely related, therefore when price of bonds rises, interest rate decreases till the equilibrium point E is not reached.
Similarly, at i→ i3:
Demand for real balances > supply of real balances, individual will sell their bonds. To attract funds the banks will increase the interest rate till the equilibrium point E is not reached. [Real balance means money]
Derivation of LM Curve:
By selecting arbitrary interest rates and finding income level which is consistent with money market equilibrium, we derive the LM curve which is positively sloped. The LM curve shows different income levels at different interest rates where demand for money is equal to the supply of money at a given nominal money supply and given price level.
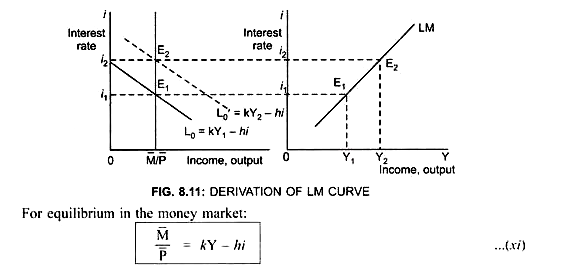
(i) Assume the income level is Y1 (Fig. 8.11):
Corresponding demand curve for real balances is L0, which is downward sloping because demand for real balances (L2) is a decreasing function of the interest rate. Supply of real balance is M/P is a vertical straight line because it is given by the monetary authorities and is independent of the interest rate.
At interest rate i1
Demand for real balances = Supply of real balance at point E1.
Therefore, E1 is an equilibrium point in the money market.
By plotting combination of interest rate (i1) and income level (Y1) we get a point (E1) on the LM curve.
ADVERTISEMENTS:
(ii) If the income level increases from Y1 to Y2 (Y1 < Y2):
(a) Demand for real balances at the given interest rate (i1) increases. As a result the demand curve for real balance shifts upwards towards the rights from L0 to L’0. Therefore, income level increases. Thus, increase in interest rate is accompanied by an increase in the income level.
(b) Given the fixed money supply, due to an increase in the income level, the demand for money will increase. To bring equilibrium in the money market interest rate will increase. Thus, the interest rate rises to i2.
Reason:
When demand for money is greater than the supply of money, people will sell bonds in the market. As a result stock of bonds in the market increases. This will lead to fall in the price of bonds and rise in the interest rate.
(c) But when the interest rate rises, the demand for money decreases and thereby brings an equilibrium in the money market. This is attained at point E2.
ADVERTISEMENTS:
Thus, E2 corresponds to another equilibrium point in the money market, and thus another combination of interest rate (i2) and income level (Y2) is achieved corresponding to point E2 on the LM curve.
Reason:
When ↑i, dd for real balance ↓because L2 is inversely related to i
To maintain demand for real balance (L = L1 + L2) = Fixed supply of money (M/P), transaction demand for money L1 has to be increased. Therefore, income level is increased.
Thus ↑i is accompanied by ↑ in Y.
Similarly, we can get a number of combination of i and Y that can be linked to give the LM curve.
By joining the points E1 and E2 we get the LM curve. The LM curve is positively sloped which shows an inverse relationship between the interest rate and the demand for real balances and direct relationship between the interest rate and the output level.
Thus, the money market equilibrium shows that an increase in interest rate is accompanied by an increase in income.


