Read this article to learn about Derivation of Aggregate Demand Curve which is explained with diagrams!
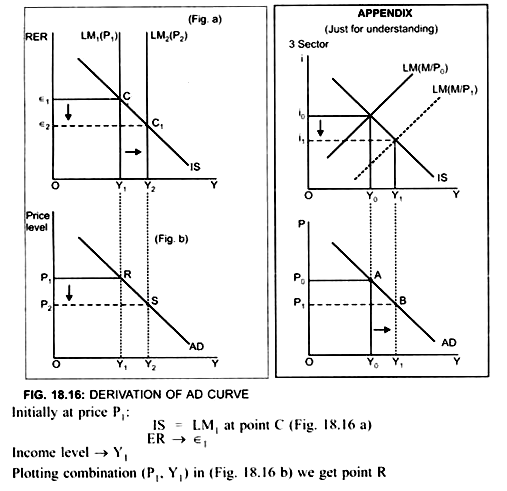
AD curve shows negative relationship between the price level and the income level (output).
All variables of IS curve are real variables and therefore are not affected by the prices. However, when price changes e.g. falls, real money supply changes, that is, increases and thus, the LM curve is affected (shifts to right).
If price falls from P1 to P2
Real Money supply/balances rises from M/P1 to M/P2
Result:
LM curve shifts to the right from LM1 to LM2
ADVERTISEMENTS:
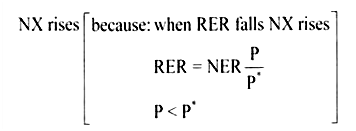
RER falls from є1 to є2
Equilibrium income level rises from Y1 to Y2.
Plotting combination of Y2 and P2 in the lower panel (Fig. b) we get point S
ADVERTISEMENTS:
Join points R and S we get the AD curve which is negatively sloped.


