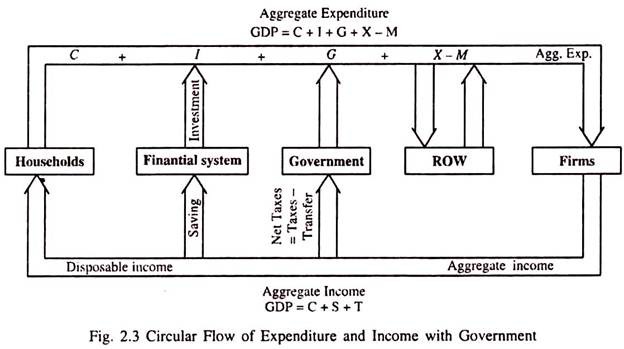
Let us make an in-depth study of the Circular Flow Model of National Income with Government.
National income and product accounting demonstrates that expenditure on final product generates income.
The income, in turn, generates purchases of final products, which then result in more income as the process goes on and on.
We illustrate the equivalence of income and expenditure with an extended circular flow diagram which includes, along with households and businesses, the government sector as well. See Fig. 2.3.
1. The upper part of Fig. 2.3 represents expenditures on final products, while the lower part represents a flow of income generated by the purchases. The figure shows the types of expenditure which generate income. It also shows how income is spent by households, firms and government.
2. Expenditure for purchase of final products generates income which then ends up being spent by consumers, investors, and governments. The above diagram shows the circular path of expenditure and income in the economy.
3. In the upper part of Fig. 2.3 household consumption (C) accounts for the bulk of GDP from the expenditure side. To this we add investment purchases (I), which are the flows of expenditures as funds from the nation’s financial system and are used to finance acquisition of machinery, new structures, and other investment goods. Government purchases (G) represent another addition to the flow of spending.
Finally, moving down along the upper part toward the box marked ‘business firms’, we see that some spending is for import purchases (M) from the rest of the world (ROW), which are removed from the circular flow and are not received as income by firms and households.
ADVERTISEMENTS:
However, exports (X) are foreign purchases of domestic product that help generate income from the ROW. The difference (X – M) represents net exports. Now we reach the box marked ‘business firms’ and see that the total spending has grown to the sum of C + I + G + X-M which represents GDP expressed as the sum of expenditure components.
4. The expenditure on final products generates the aggregate income earned by owners of business firm and members of households. The income is paid out as compensation to employees, net interest on funds borrowed and rents, and a portion is set aside (saved) by business firms as capital consumption allowance (depreciation). The remainder is profit.
5. Now we are back in Fig. 2.3 to the box marked ‘Households’, and the process begins all over again. Expenditure on final products during the year has provided households with the income necessary to finance their consumption.
Income is used for consumption purchases (C), household and business savings (5), or the payment of the difference between taxes and government transfers (net taxes = gross taxes – transfers = T). GDP expressed as the sum of income uses is: GDP = C + S + T.
