Get the answer of: What happens to the National Income Equilibrium when Level MPC Increases or Decreases?
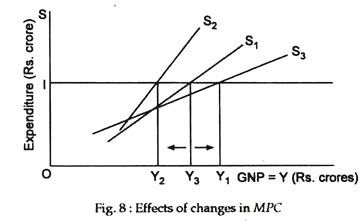
Since MPC = 1 – MPS an increase in MPS implies a fall in MPS. The MPS measures the slope of the saving line. It is expressed as ΔS/ΔY. Thus if MPC increases and MPS falls the saving line becomes flatter, i.e., its slope falls. As a result equilibrium national income will increase.
The converse is also true. If MPC falls and MPC rises, the saving schedule will become steeper and equilibrium national income will fall. The effects of changes in MPC on equilibrium national income are illustrated in Fig.8. Here, we show three saving schedules.
The original saving schedule is Si and equilibrium national income is Y0. If MPC rises or MPS falls the saving schedule becomes S3 and equilibrium national income increases to Y2. If MPC falls or MPS rises S2 will be the new the saving schedule and equilibrium national income falls to Y2.
ADVERTISEMENTS:
We may now show the effect of change in MPC on equilibrium national income through the multiplier. The multiplier is the ratio of the increase in income (ΔY) to the increase in investment that brought it about (ΔI). If autonomous investment increases by Rs. 1,000 crores and as a result national income increases by Rs. 5,000 crores the value of the multiplier (m) is
m = ΔY/ΔI = Rs. 5,000 crores /Rs. 1,000 crores = 5.
This tells us that for every Re.1 increase in autonomous investment expenditure, equilibrium income rises by Rs. 5. Thus, it is clear that the multiplier is the ratio of the change in income to the initiating change in autonomous spending (investment) that brought it about.
ADVERTISEMENTS:
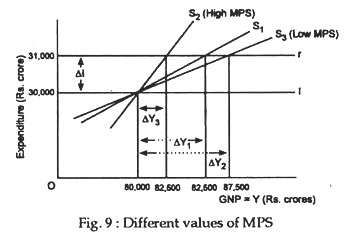
We may now consider the effect of an increase or decrease of MPC on equilibrium national income through the multiplier mechanism. Now consider Fig. 9. It shows that the size of the change in income brought about by a shift of the investment function of Rs. 1,000 cr. from I to T’ differs according to the slopes of the saving curve.
The slope of the saving curve measures MPS and its reciprocal is the investment multiplier. If MPC increases, MPS will fall and the value of the multiplier will increase. So, for the same increase in I, Y will increase much faster. The converse is also true. The three lines, S1, S2 and S3 represent three alternative saving curves with slopes 0.40, 0.20 and 0.133. In response to a change in investment of Rs. 1,000 cr. (i.e., ΔI = Rs. 1,000 cr.), the respective changes necessary to restore equilibrium are,
ΔY = Rs. 2,500 cr.,
ADVERTISEMENTS:
ΔY = Rs. 5,000 cr.,
and ΔY = Rs. 7,500 cr.
The values of the multiplier are thus 2.5, 5 and 7.5, respectively. This shows that if MPC increases or MPS falls, the saving schedule becomes flatter and the larger must be the increase in income before saving increases enough to equal the new level of investment. Thus, the larger is the value of the multiplier.

