Let us make an in-depth study of the evaluation and application of consumers’ and producers’ surplus.
Evaluation of Consumers’ and Producers’ Surplus:
A price ceiling causes the quantity of a good demanded to rise and the quantity supplied to fall, so that a shortage results.
The consumers who can still buy the good will be better off because they will now pay less.
But if we take into consideration those who cannot obtain the good, how much better-off are consumers as a whole? Might they be worse-off?
ADVERTISEMENTS:
And if we lump consumers and produces together, will their total welfare be greater or lower, and by how much? To answer these questions, we need to measure the gains and losses from government interventions and the changes in market price and quantity such intervention cause. We will calculate the changes in consumer’s and producer’s surplus that result from intervention.
In an unregulated, competitive market, consumers buy and producers sell at the market price. But, for some consumers, if the value of the good exceeds this market price, they would be prepared to pay more for the good if they had to. Consumer’s surplus is the total benefit consumers receive beyond what they pay for the good.
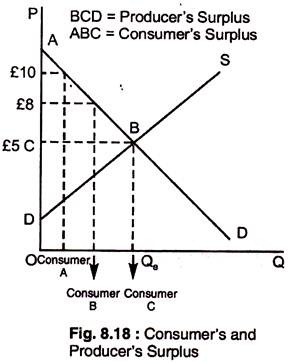
Suppose the market price is £5 per unit, as in Fig. 8.18, but some consumers value the good highly and are prepared to pay more than £5 for it. For example, consumer A would pay up to £10 for it.
However, because the market price is only £5, he enjoys an extra benefit of £5. Consumer B values the good less highly and would be willing to pay £8, and, thus, enjoying an extra benefit of £3. Finally, consumer C values the good at exactly the market price, £5, and enjoys no extra benefit.
ADVERTISEMENTS:
Consumer’s surplus is the area between the demand curve and the market price. And, because consumer’s surplus measures the total net benefit to consumers, we can measure the gain or loss to consumers from a government intervention by measuring the consumer’s surplus. Producer’s surplus measures the aggregate profits of producers, plus rents to factor inputs.
Some producers are producing units at a cost just equal to the market price and other units are produced for less than the market price, and would be produced and sold even if market price were lower. Producers enjoy a benefit — a surplus — from selling those units. For each unit, this surplus is the difference between the market price and the MC of producing this unit.
For the market as a whole, producer’s surplus is the area above the supply curve up to the market price; this is the total profit plus rents that lower-cost producers enjoy by selling at the market price. Because producer’s surplus measures the total net benefit to producers, we can measure the gain or loss to producers from a government intervention by measuring the resulting change in producer’s surplus.
Application of Producers’ and Consumers’ Surplus:
ADVERTISEMENTS:
The price of a good has been regulated to be no more then Pmax, which is below the market- clearing price P The gain to the consumers is the difference between areas A and B. The loss to producers is the sum of area A + area B. Areas B + C measures the deadweight loss from price controls. If politicians value consumers’ surplus more highly than producers’ surplus, this deadweight loss may not carry much political weight.
However, if the demand curve is very inelastic, price controls can result in a net loss of consumers’ surplus, as shown in Fig. 8.19 where area B, which measures the loss of consumers who have been rationed out of the market, is larger than the rectangle A, which measures the gain to consumers able to buy the good. Here, consumers value the good highly, so those who are rationed out suffer a large loss.

