Markowitz Model had serious practical limitations due to the rigours involved in compiling the expected returns, standard deviation, variance, covariance of each security to every other security in the portfolio. Sharpe Model has simplified this process by relating the return in a security to a single Market index. Firstly, this will theoretically reflect all well traded securities in the market. Secondly, it will reduce and simplify the work involved in compiling elaborate matrices of variances as between individual securities.
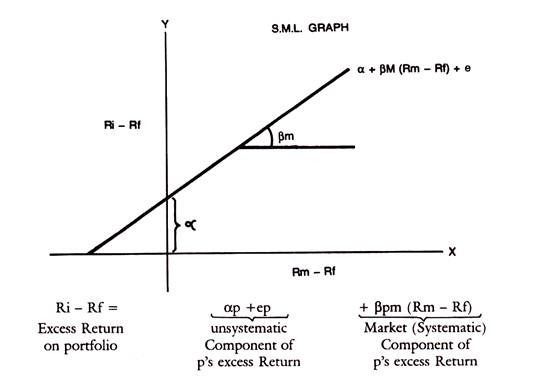
If thus the market index is used as a surrogate for other individual securities in the portfolio, the relation of any individual security with the Market index can be represented in a Regression line or characteristic line. This is drawn below, with the excess return on the security on the y-axis and excess return on the Market Portfolio on the x-axis.
The equation of the characteristic line is Ri – Rf = a + βim (Rm – Rf) + ei
Ri is the holding period return on security i
ADVERTISEMENTS:
Rf is the riskless rate of interest
Alpha is the vertical intercept on y-axis representing the return on the security when only unsystematic risk is considered and systematic risk is measured by Beta. ci is the residual component, not captured by the above variables.
The sharpe equation is as follows:
ADVERTISEMENTS:
Rj = αj + βj + ej
Where αj is some constant, say risk free return
βj is the Beta which is a risk measure of the market called systematic risk
I is the value or return on the stock index.
ADVERTISEMENTS:
ej is the residual factor which cannot be specified.
Optimal Portfolio of Sharpe Model:
This optimal portfolio of Sharpe is called the Single Index Model. The optimal portfolio is directly related to the Beta. If Ri is expected return on stock i and Rf is Risk free Rate, then the excess return = Ri – Rf This has to be adjusted to Bi, namely,
Ri – Rf/βi which is the equation for ranking Stocks in the order of their return adjusted for risk.
The method involves selecting a cut-off rate for inclusion of securities in a portfolio. For this purpose, excess return to Beta ratio given above has to be calculated for each stock and rank them from highest to lowest. Then only those securities which have Ri – Rf/βi, greater than cut-off point, fixed in advance can be selected.
The basis for finding the cut-off Rate Ci is as follows:
Basis for Cut-off Rate:
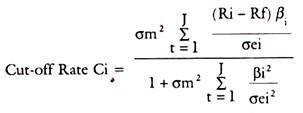
For a portfolio of i stocks, Ci is given by cut-off rate-
σm2 = variance in the market Index
ADVERTISEMENTS:
σei2 = variance in the Stock movement in unsystematic Risk.
Ri, Rf, Bi have the same meanings as referred to above.
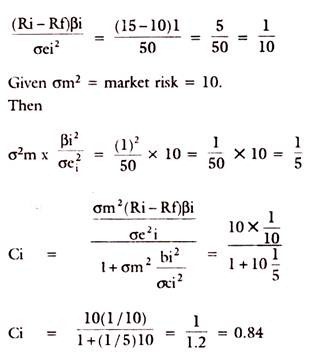
Take an example. Rf = 10, Beta = 1
Expected Return Ri = 15, σei2 = unsystematic risk is given by 50, then,
ADVERTISEMENTS:
We have-
Example:
We have to see that for the optimum Ci that is C*, to be selected, the securities should have excess return to Betas above Ci. Excess return to Beta ratio should be above Ci to be included in the portfolio, to be precise. This Ci is that point which shows the cut-off point among those excess returns to Beta ratios.
ADVERTISEMENTS:
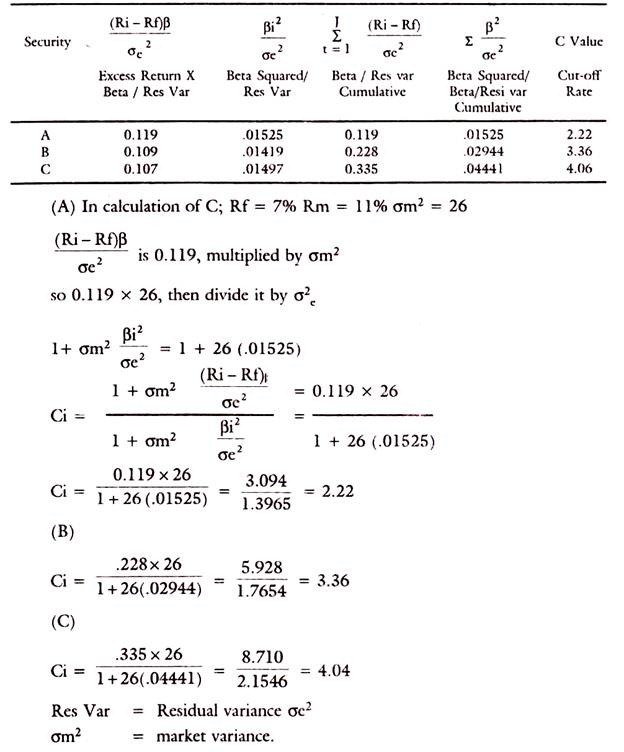
The calculation of C requires data, which are shown below:
Rf = Risk free Return = 5%
Based on the above data, we have to calculate the ‘C’ values for each security for inclusion in the optimum portfolio.
The following table gives the example:
ADVERTISEMENTS:
All securities with excess return to Beta ratio above the cut-off rate C*, say 3.0 in the above table will be chosen in the portfolio. The calculation of cut-off point is also explained. In arriving at the optimal portfolio, the emphasis of Sharpe Model is on Beta and on the Market Index. Sharpe’s optimal portfolio would thus consist of those securities only which have excess return to Beta ratio above a cut-off point.
By this method, selection of the portfolio has become easier due to the ranking of the securities in the order of their excess return and applying the yardstick of a required cut-off point for selection of securities. That cut-off point is related to the excess return to Beta ratio on the one hand and variance of the market index σm2 and variance of the stock’s movement which is related to the unsystematic risk, namely, σei2.
It is thus seen that Sharpe’s Portfolio takes into account both the systematic market related risk and unsystematic risk and residual risk.
Distribution of Investments:
Once the choice of securities is made then one has to decide the proportion of his funds to be invested in each security.
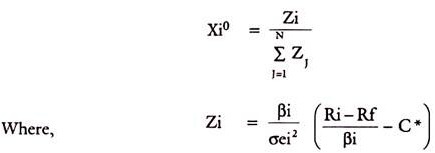
The percentage to be invested in each security is-
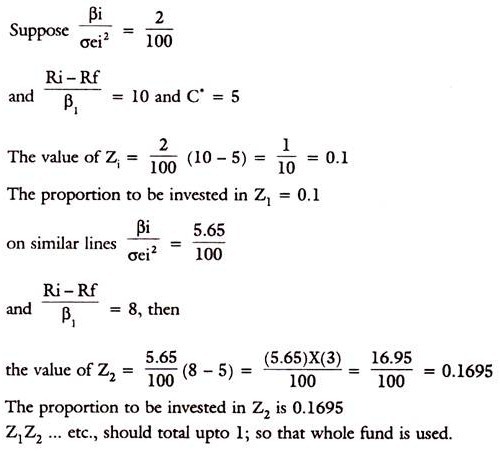
The second expression in the bracket will determine the proportion of funds to be invested in each security. The first expression simply scales the weight on each security, so that the total is summing upto 1.
