In this article we will discuss about the meaning of a production possibility curve.
Suppose a farmer has one input with which he can produce two products namely Y1 and Y2. We assume that the other inputs are highly specialized and can be used for producing a specific crop only. So, problem of their allocation over various crops does not arise. With the given input x1 the farmer can produce either only Y1 or only Y2 or some combination of these two crops.
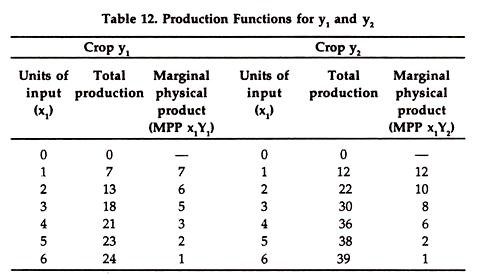
How much of Y1 or Y2 can be produced with x1 depends upon the production functions given below:
If is evident from the above that if the farmer has only 6 units of x1 he can either produce 24 units of Y1 or 39 units of Y2.
ADVERTISEMENTS:
If instead of producing only Y1 or only Y2 , the farmer chooses to produce both Y1 & Y2 with x1 he can have many combinations of these crops.
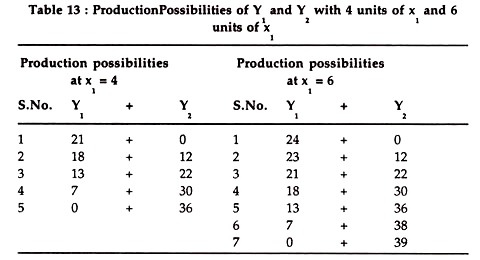
Below we give some of these combinations of Y1 & Y2 based upon the above production functions, on the assumption that (a) he has only 4 units of x1 (input) and (b) he has only 6 units of x1.
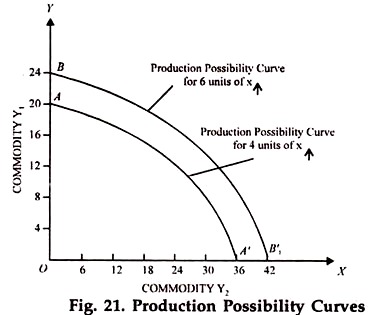
Various combinations of Y1 and Y2 in the above schedule represent production possibilities with four units and six units of the variable input x1 Production possibilities, we may state, show all possible combinations of two or more products that can be obtained using the same amount of variable input say, x1. The graphic representation of these production possibilities (in case of two commodities) is named as a production possibility curve, or a production possibility frontier which is depicted in Fig. 21.
In Fig. 21 whereas production possibility curve AA’ shows all combinations of two products Y1 and Y2 that can be produced by using four units of variable input x1 production possibility curve BB’ shows combinations of Y1 & Y2 which can be produced with six units of variable input x1.
These curves are also known as product transformation curves because one product is transformed into another product, (not physically) by transferring from one product to another. Finally these may also be called iso-resource curves because each output combination on any of such curves uses the same amount of resources.
The Marginal Rate of Product Substitution (MTPS) or Marginal Rate of Transformation:
ADVERTISEMENTS:
MRPS measures the extent to which the quantity of one product changes when the output of the other product is increased by one unit, provided that the total amount of the input used to produce them remains constant.
The marginal rate of product substitution of Y2 for Y1 given by:
In other words, if we are given a production possibility curve, MRPS is represented by the value of the slope of the production possibility curve at a given point. The slope of production possibility curve is generally negative.


