Selling Costs: Definitions, Assumptions, Equilibrium!
Selling costs play the key role in monopolistic competition and oligopoly. Under these market forms, the firms have to compete to promote their sale by spending on advertisements and publicity.
Moreover, producer has not to decide about price and output and he also keeps in view how to maximize the profit.
Thus, cost on advertisement publicity and salesmanship ads to the demand of the product. We do not find perfect competition or monopoly in the real world but monopolistic competition or oligopoly. In short, selling costs is a broader concept than the advertisement expenditures. Advertisement expenditures are part of selling costs.
ADVERTISEMENTS:
In selling costs we include the salaries of sales persons, allowances to retailers to display the products etc. besides the advertisements. Advertisement expenditure includes costs incurred for advertising in newspapers and magazines, televisions, radio, cinema slides etc. It was Chamberlin who introduced the analysis of selling costs and distinguished it from the production costs. The production costs include all those expenses which are spent on the manufacturing of the commodity, its transportation cost of handling, storing and delivering of the commodity to actual customers because these add utilities to a commodity.
On the other hand, all selling costs include all expenditures in order to raise demand for a commodity. In short, selling costs are those which are made to create the demand for the product. Transport costs should not be included in selling costs; rather these should be included in the production costs. Transport costs actually do not increase the demand; it only helps in meeting the demand of the consumers.
In the same fashion, high rents are not the part of selling costs. High rents are paid so as to meet the already existing demand of the people. According to Edward H. Chamberlin, “Those costs which are made to adopt the product to the demand are costs of production; those made to adopt the demand to product are costs of selling.”
Definitions:
“Selling costs are costs incurred in order to alter the position or shape of the demand curve for the product.” E.H. Chamberlin
ADVERTISEMENTS:
“Selling costs may be defined as costs necessary to persuade a buyer to buy one product rather than another or to pay from one seller rather than another.” Meyers
Assumptions:
Basically, the concept of selling cost is based on the following two assumptions:
1. Buyers do not have any perfect knowledge about the different types of product.
2. Buyers demand and tastes can be changed.
Difference between Selling Costs and Production Costs:
ADVERTISEMENTS:
There is a fundamental difference between selling costs and production costs. Production cost includes all the expenses incurred in making particular product and transporting it to the consumers. They include, outlays incurred on services engaged in the manufacturing of the product like land, labour and capital etc. On the other hand, selling costs include all the costs incurred to change the consumer’s preference from one product to another. These are generally intended to raise the demand of one product at any given price.
According to E.H. Chamberlin, “Production costs create utilities in order that demands may be satisfied while selling costs create and shift the demand curves themselves.” In short, we cannot make a clear cut distinction between the selling cost and production cost. In fact, both the costs are inter-related throughout the price system, so that at no point it can be said that one has ended and the other is to begin.
Average Selling Cost:
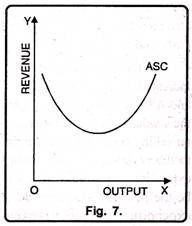
The curve of selling cost is a tool of economic analysis. It is a curve of average selling cost per unit of product. It is akin to the average cost curves. In other words, like the cost curves, selling costs are also of U-shape. Moreover, there are two terms according to which the curve of selling cost is drawn. But, in both the cases, the shape of selling cost differs from one another. This has been illustrated with the help of a Fig. 7.
In Fig. 6 (A) ASC is the average selling cost. In the initial stage, the curve falls and later it starts rising. It means in the beginning proportionate increase in sale is more than the increase in selling costs, but after a point proportionate increase in sale is less than the selling cost. It signifies the fact that up to a certain level per unit selling cost go on to diminish but after that the same tend to increase. But, the ASC neither will touch the X-axis nor it will be zero. In other words, the ASC will form the shape of rectangular hyperbola.
Equilibrium with Selling Costs (Variable Costs):
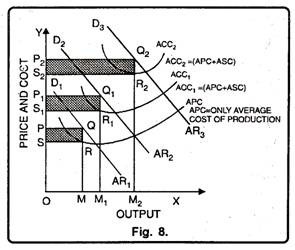
Selling costs influence equilibrium price-output adjustment of a firm under monopolistic competition. In the Fig. 8. APC is the initial average production cost. AR1 is the initial average revenue curve or initial demand curve. The initial price is OP and the firm earns profits shown by the first shaded rectangle PQRS.
ACC1 is the average composite costs curve, which includes the average selling cost (ASC). Average selling cost is equal to the vertical distance between APC and ACQ. The new demand curve is AR2. It is obtained after incurring selling costs or after making advertisements.
It is, obvious, that the demand for the product has increased as a result of selling costs. The profits have also increased as a result of selling costs. The profits after incurring selling costs at OM1 level of output become equal to the shaded area P1Q1R1S1. Now these profits are greater than the initial level of profits when no selling cost is incurred, i.e., P1 Q1 R1 S1 > PQRS.
ADVERTISEMENTS:
ACC2 is the average composite cost when more additional cost is incurred, as a result of which the demand for the product further increases. The new demand curve is AR3 which indicates a higher demand for the product. The profits are also greater than before since the shaded area P2Q2R2S2 > P1Q1R1S.
It is, thus, obvious that the demand for the product is increasing as a result of the selling costs. Since selling costs are included in the cost of production, therefore price of the product is also increasing as a result of selling costs. Profits are also increasing as a result of higher selling costs and increased demand. In the above diagram, the effect of selling outlay on competitive advertisement has been indicated. Before selling costs are incurred, the firm’s average revenue or demand curve is AR1 and APC is the basic initial cost of production.
So, the firm earns maximum profits as shown by the shaded area PQRS. Here, question arises, how long a firm may go on incurring expenditure on selling costs? It will continue to make expenditure on selling costs as long as any addition to the revenue is greater than the addition to the selling costs. The firm will stop incurring expenditure on selling costs when the total profits are at the highest possible level.
This would be the point at which the additional revenue due to advertising expenditure equals the extra expenditure on advertisement. It should, however, be noted clearly that the effects of advertisement on prices and output are uncertain. Advertisement by a firm may be considered successful if the elasticity of demand for its product falls.
Equilibrium with Selling Costs (Fixed Costs):
ADVERTISEMENTS:
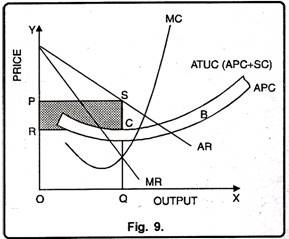
In modern times, a lot of money is spent on selling costs. Of course, it becomes difficult to determine the most profitable output. At the same time, we also know that selling costs create a new demand curve. However, here equilibrium is determined when there are fixed selling costs as shown in Figure 9.
In Fig. 9, AR is the average revenue or demand curve. MR is the marginal revenue curve. The average production cost (APC), the shaded area B shows the selling cost. This shows that by adding selling cost in average production cost, we get average total cost. (ATUC = APC + SC) SC is the net return per unit while SQ is the price minus SC – the average total unit cost and OQ is the level of output. Thus shaded area PRCS is the maximum net return and OQSP is the total revenue minus total cost OQCR.
Product Differentiation:
According to Chamberlin product differentiation is one of the most important feature of monopolistic competition. Product differentiation indicates that goods are close substitutes but are not homogeneous. They differ in colour, name, packing, size etc. For instance, you may get a variety of soaps in the market like Moti, Sandal, Lux, Hamam, Rexona, Lifebouy etc. All these are close substitutes but at the same time, they differ from each other.
Main Peculiarities of Product Differentiation:
ADVERTISEMENTS:
The main peculiarities of product differentiation are as under:
1. Due to product differentiation, goods are not homogeneous.
2. Product differentiation aims at to control price and increase profits.
3. Product differentiation satisfies people’s urge for variety.
4. Product differentiation may be real or artificial.
5. Product differentiation provides the producer name and brand legally patented.
Demand Curve under Product Differentiation:
ADVERTISEMENTS:
The credit goes to Prof. Saraffa to introduce the concept of product differentiation under monopolistic competition on the basis of downward sloping demand curve. But Chamberlin introduced it on the basis of price and output determination.
Chamberlin opined that demand for product is influenced not by price only but also the style of the product and selling costs. It is so because aim of product differentiation is to inspire the consumer to demand a particular product. The producer is no longer entirely price taker; he becomes partially a price maker. As a result demand curve assumes negative slope. It indicates that when price falls demand will be more and vice-versa.
Equilibrium and Product Differentiation:
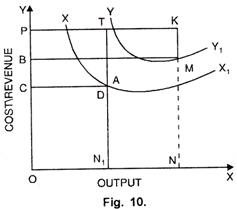
Product differentiation also affects the equilibrium of the firm under monopolistic competition. It has been shown in Fig. 9, supposing there are two types of products X and Y and no selling costs are incurred for the sale of these products. The producer has to decide about the quality of the product so as to maximize his profit. If the price of the product is already fixed, then the firm has to choose the product which has larger sales and will bring maximum profits.
In Fig. 10, XX1 and YY1 are the cost curves for products X and Y. The cost curve of Y is highest which shows that Y product is of a better quality. Both the products can be sold at price OP. At price OP, ON1 amount of X commodity can be sold and the profit is CDTP. At price OP, ON1 amount of Y commodity can be sold and the profit is BMKP which is higher than the profit which can be earned by sale of X commodity. Hence, the producer will choose to produce Y commodity.


