Let us make an in-depth study of the presentation of statistical data.
(a) Textual Presentation:
Here, with this device, we try to represent the collected data, its nature and behaviour, completely literally in terms of a lucid and precise language so that people from all categories or professions can realise the situation and the reality.
It is, no doubt, much difficult for the investigators to extract the true picture and the important properties of the data through it. So collected, the presentation should be brief and considerably precise having logical sequences. Official reports are usually prepared in this fashion.
For instance, India’s infant mortality rate (i.e., deaths per 10,000 live births) in 2000 was 69. It declined to 50 in 2009. Again, the growth rate of eight core sector industries declined to 2.1 p.c. in August 2012 from 3.8 p.c. in August 2011, owing to contractions in output of crude oil, natural gas, fertilisers and cement. This kind of data presentation encounters same problems. By nature the text is not only lengthy but also difficult to grasp, particularly if the text contains a long list of information.
(b) Tabular Presentation:
ADVERTISEMENTS:
Here, the technique is to represent the data through a complete and comprehensive statistical table and the method so followed is known as tabulation. The table, so constructed, must include all the given information. It should be simple enough and be presented in a concise format and in that sense preparation of an ideal table is definitely a fair art. An orderly and systematic presentation of numerical data in rows and columns are presented in the form of a self- explanatory table so as to clarify the problem under consideration.
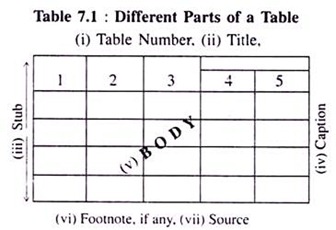
A complete table must possess the following parts in an order:
(i) Table number:
At the very beginning the table must contain a particular number at the top for its identification and ready reference for future purposes.
ADVERTISEMENTS:
(ii) Title:
A brief statement signifying the nature of information lying inside the table should be there next to the table number.
(iii) Stub:
It will exist at the extreme left part of the table and will express the specific issues taken horizontally in rows.
ADVERTISEMENTS:
(iv) Caption:
It is vertically placed at the upper part of the table in columns. Each column must have a definite number and the unit in which the figures are noted inside.
(v) Body:
It represents the most important part of the table and usually placed at the middle of the entire table expressing several numerical contents of it.
(vi) Footnote:
Further explanation on any item already included in the table, if felt necessary afterwards, will be shown here. This will surely help us to understand the matter more clearly.
(vii) Sources of information:
And finally, at the bottom of the table, we must not forget to mention categorically the name of the original source from where the information are made available. The source, of course, should be unquestioningly authentic in nature and the specific period during which the data are collected must be mentioned.
A hypothetical example of an ideal table showing its different parts is given below:
ADVERTISEMENTS:
It may be mentioned here that there is no ideal method of tabulation.
Nevertheless, some general rules are required to be followed:
First, units of measurement (e.g. height in cm), generally shown at the top of columns, must be shown clearly. Secondly, the table should be well-balanced in length and breadth. A long table may give inaccurate information. Thirdly, unnecessary details should be avoided as far as practicable. If possible, small tables showing unnecessary information may be constructed separately.
Types of Tabulation:
ADVERTISEMENTS:
The usual techniques of tabulation are:
(a) Simple tabulation, and
(b) Complex tabulation.
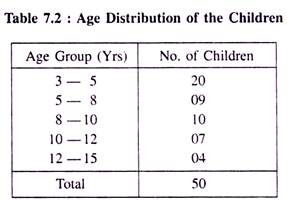
Information on a single variable showing only one important property when expressed in a tabular form is called simple tabulation. Conversely, a table can also consider more than one variable with a number of separate properties exhibited therein is called complex tabulation. Let us prepare at this stage two separate tables (simple and complex) with the aid of an imaginary data set.
ADVERTISEMENTS:
(a) Simple Tabulation:
Statistical tables, to make them easily understandable, are very often represented simply in the following manner called simple tabulation.
Table 7.2 is an example of simple tabulation where data are shown through a simple or one-way table. From this one way table, one obtain answer to questions about one characteristic feature of data only. In other words, simple tabulation gives information about one independent question.
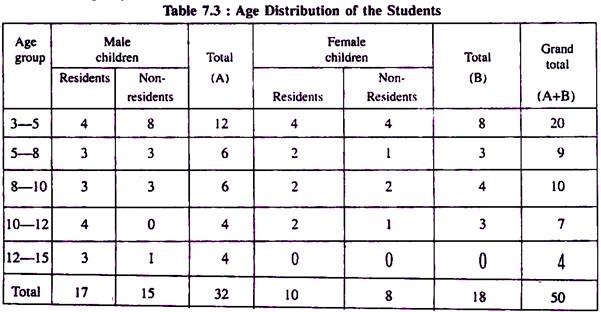
On the other hand, complex tabulation, also called two-way table, shows splitting up of data in two or more categories so as to provide information about one or more sets of interrelated questions. If the number of children in accordance with age-groups shown in table 7.2 is split up or further divided sex-wise, the table becomes a two- way complex table. This has been shown in Table 7.3 below where the number of children has been divided again not only sex-wise, but also resident wise between male and female children.
(b) Complex Tabulation:
ADVERTISEMENTS:
Complex tables exhibiting a number of separate information simultaneously are usually represented in the following way:


