This article will guide you about how to derive the backward bending supply curve of labour.
So far we have considered two types of labour supply curve. One is perfectly elastic and the other is upward sloping curve. A perfectly elastic or a horizontal supply curve of labour is not found in reality. An individual labour supply curve is likely to be positive sloping indicating larger supplies of labour at a higher wage rate. But this is not always so.
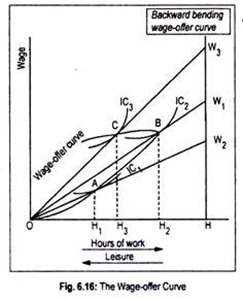
That means, a worker may be induced to work less when his wage rate tends to rise. Thus, labour supply curve may be backward bending. How such individual supply curve of labour is derived may be described in terms of Fig. 6.16.
We know that the individual supply of labour depends on the wage rate. Usually, as wage rate rises, an individual labour supplies more working hours than before. But there is another temptation on the part of the worker—the temptation of less work and more leisure.
ADVERTISEMENTS:
Once the optimum wage is earned by a labour, further increase in wage rate may induce him to work less and take more leisure. Leisure is attractive too.
As a result, labour supply curve becomes backward bending. This has been shown in terms of indifference map between work (or leisure) and wage. A labour’s indifference curve represents different combinations of work or leisure and wage that yield the same amount of utility to the labour.
The level of utility, however, depends on total wage earnings and total leisure hours (or working hours). An individual cannot work 24 hours a day, so he must take leisure. Remember that leisure is not an ‘inferior good’. Wage to a labour is considered as a ‘good’ while more work is considered as a ‘bad’ commodity.
ADVERTISEMENTS:
In Fig. 6.16, we measure working (or leisure) hours on the horizontal axis and wage rate on the vertical axis. Let us assume that an individual labour can work up to OH hours, rather than 24 hours. IC1, IC2, and IC3 are three indifference curves. Higher indifference curve represents higher level of utility.
We have drawn three straight lines OW1, OW2, OW3 whose slopes represent different wage rates. These lines are called wage constraint line or simply, the budget lines. Higher the line, higher is the wage rate. The worker will reach equilibrium when the slope of the budget line equals the slope of the indifference curve.
In other words, equilibrium occurs at that point where budget line becomes tangential to the indifference curve. The slope of the line OW1 represents a wage rate equal to AH1/OH1. At this wage rate, an individual works OH1 hours and takes leisure of H1H hours.
The slope of the line OW2 represents higher wage rate than OW1and the worker maximizes his utility at point B. At this point, slope of the line OW2 = (= BH2/OH2) is equal to the slope of the IC2. Since BH2/OH2> AH1/OH1, the workers supplies more working hours (i.e., OH2) and takes fewer leisure hour (i.e., H2H).
ADVERTISEMENTS:
Further increase in wage rate induces labour to enjoy more leisure and less work, since leisure is a ‘good’ commodity. The slope of the line OW (= CH3/OH3) indicates higher wages. Corresponding to the equilibrium point C, the individual worker now works fewer hours (i.e., OH3 < OH2) and enjoys more leisure hours (i.e., H3H > H2H).
Now, by joining these points of equilibrium (A, B and C), we obtain wage-offer curve. Initially, this curve is upward rising but once point B is reached it takes a backward turn. This means that, in the initial stage, supply of labour rises as wage rate rises, but, ultimately, supply of labour declines as wage rate rises.
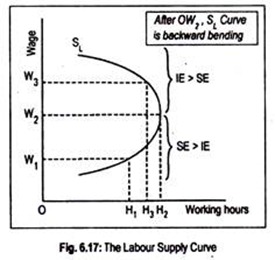
This backward bending wage-offer curve may be used to derive a backward bending labour supply curve. In this connection, we may use the concepts of income effect (IE) and substitution effect (SE of wage change).
Higher wage rate induces a worker to work more instead of availing more leisure. To the worker, as leisure is now expensive, higher wage rate encourages a substitution of work for leisure. This is called substitution effect.
Substitution effect is always positive. It is because of the positive substitution effect that an individual labour tends to work more when wage rate rises. This is evident from Fig. 6.17. As wage rate rises from OW1 to OW2, the supply of labour rises from OH1 to OH2. As wage rate rises, the worker substitutes extra hours of work for leisure.
But as the wage rate rises, individual worker’s real income rises. This increased real income increases his demand for normal goods, including leisure. (Leisure may be an ormal or superior commodity.) This is called income effect of wage rate changes.
If the current wage rate becomes too high to an individual labour, he prefers to work less and take more leisure. In our example, if wage rate goes above OW2, the individual labour may be tempted to work less from OH2 to OH3. As a result, his leisure hours increase.
Thus, between wage rates OW1 and OW2, substitution effect (SE) is stronger than income effect (IE), inducing individual labour to work more and take less leisure. The SL curve or labour supply curve slopes upward between wage rates OW1 and OW2, and it has a positive slope. Between wage rates OW2 and OW3, income effect outweighs substitution effect, inducing our worker to work less and take more leisure.
ADVERTISEMENTS:
The supply curve of labour, SL, thus becomes backward bending. The SL curve of labour now slopes downwards. The phenomenon of some reputed city doctors working only four hours a day and taking Saturdays and Sundays as absolutely free for themselves may be an evidence; of backward bending supply curve of labour at high income levels.

