The long-run industry supply curve shows the nature of adjustment that is likely to occur under pure competition when there are changes in demand conditions. This curve shows the relation between equilibrium price and output different firms are willing to offer for sale after all desired entry or exit has occurred due to external economies and diseconomies.
In the words of R.G. Lipsey, “The long-run supply curve connects positions of long-run equilibrium after all demand-induced changes have occurred”.
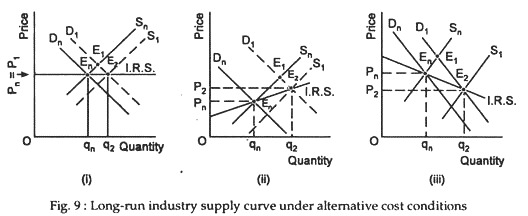
When we consider external economies and diseconomies, i.e., changes in factor prices caused by increase or decrease in demand for the product of the industry we discover three possibilities. The industry supply curve can be upward sloping, horizontal, or downward sloping. These three possibilities are shown in Fig. 9.
ADVERTISEMENTS:
(i) Horizontal Supply Curve in a Constant Cost Industry:
Sometimes the expansion of output by all firms occurs at minimum possible average total costs. This happens when output expansion or contraction by the whole industry does not lead to a rise in factor prices. If new firms can have access to the same technology and can buy factors of production at the same price, their costs per unit will be same as those of existing firms.
When this happens the industry is said to be a constant cost industry. In this industry the supply curve is a horizontal straight line as in Fig. 9. The long-run zero-profit equilibrium of such an industry is re-established only when price returns to its original level.
ADVERTISEMENTS:
(ii) Rising Supply Curve in an Increasing Cost Industry:
Sometimes we observe that what is good for a firm is not necessarily good for the industry. When all firms attempt to produce more output in response to an increase in demand for their products the demand for factors of production increases. This usually leads to a rise in factor prices (because the factors market gradually becomes imperfect).
As a result each firm has to purchase factors at higher prices. Extra wage payments are to be made and extra price has to be paid to acquire raw materials which are in short supply. All these are reflected in the cost curves of individual firms. Cost per unit starts increasing. Thus, with industry expansion the short-run supply curve shifts to the right [from S0 to S1 as in Fig. 9(ii)].
But the short-run average cost curves of individual firms shift upward due to a rise in factor prices. Thus, the firms stop producing more output as soon as the price of the product is exactly equated to the average cost of the individual firms. In other words, when P=SAC for each firm the expansion of the industry stops.
ADVERTISEMENTS:
This, of course; occurs at a price which is higher than the price that prevailed before the expansion started. This point is illustrated in Fig. 9(ii) where output expansion from q0 to q2 leads to a rise in price from p0 to p2. A competitive industry with rising long-run supply prices is called an increasing cost industry.
(iii) Falling Supply Curve in a Decreasing Cost Industry:
Output expansion by all the firms in response to an increase in demand may, however, lead to a fall in average cost of the firms. This is possible if the industry under consideration is characterised by strong internal and external economies of scale.
Thus, if a firm could reduce its average costs by setting up a larger mechanised plant, it would find it more profitable to do so without waiting for an increase in demand for its product. Since a firm can sell as much as it likes at the going market price, it will find it profitable to expand its scale of operations as long as its long-run average cost is falling. This is due to internal economies.
There may be external economies also in the production process. This will benefit all the firms. Thus, if industries supplying inputs enjoy increasing returns to scale, all the firms will be able to buy their inputs at lower and lower prices. So, their long-run average cost will fall. In other words when output expansion by an industry leads to a fall in the prices of some of its inputs, the average costs curve of the firms will shift downward as they produce more and more output.
Consequently, the industry as a whole will have falling cost per unit. Such a case is illustrated in Fig. 9(iii) where the industry supply curve is downward sloping. Here, a larger quantity of the product is offered at a lower price. Such an industry is called a decreasing- cost industry. (This shows an important exception to the Law of Supply.)
In this context Lipsey has cited the example of the car industry. The early stages of the growth of the car industry indicates how the expansion of one industry could lead to a fall in prices of some of its inputs. With an increase in demand for cars, the demand for tyres also increased. This, in its turn, raised the demand for rubber and tended to raise its price.
But, an increased demand for tyres gave an opportunity to tyre manufactures to set up larger plants that could make use some of economies (i.e., advantages of large-scale production) available in tyre production. These economies were so strong as to neutralise the effect of any rise in rubber price. Consequently tyre- prices fell and car manufactures could buy tyres at lower prices. Since tyre is an important input of car industry, the net result was a fall in car prices.
It may be noted that the economies were external to the car industry, but internal to the tyre industry. Thus, for a decreasing cost industry to exist it is essential for its input- supplying industry not to be perfectly competitive industry, whose own scale economies have not yet been fully enjoyed because of insufficient demand.
