Market Supply: Movements, Relation with Time and Conventional Time Periods!
Subject Matter:
To get total or market supply, we have to add the supplies of all the producers of a product. Suppose there are two producers of carrots in an area, viz., A and B. Both of them supply carrots at the same point of time.
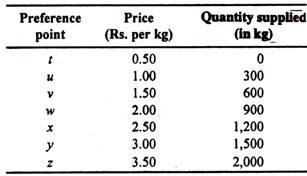
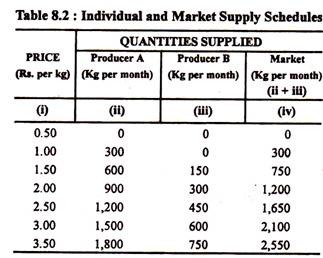
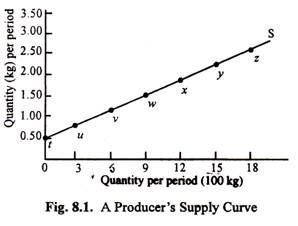
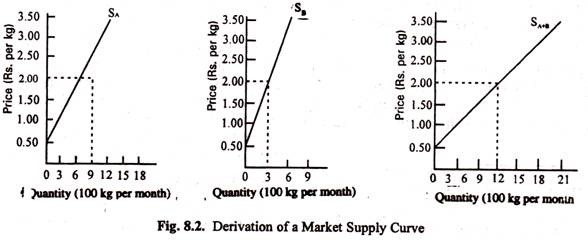
We show the supply schedule and the supply curve of the first producer, i.e., A, in Table 8.1 and Fig. 8.1 above. These are reproduced in Table 8.2 and Fig. 8.2. But Table 8.2 and Fig. 8.2 contain additional information. In Table 8.2 we also show the supply schedule of another producer, viz., B. Similarly, in Fig. 8.2 we draw the supply curve of B. Here we assume that the minimum price at which B can offer a positive quantity (i.e., Re. 1) is higher than required by A (i.e., 50 paise).
Table 8.1: A Producer’s Supply Schedule for Carrots
The market supply curve is derived simply by adding the quantities supplied at each price by the two producers. Thus we see that when the market price of carrots is Re. 1.00, producer A offers a positive quantity (viz., 300 kg) but producer B offers nothing. So market supply is the same as individual supply (i.e., the amount offered by producer A).
Producer B is less efficient than producer A, i.e., B’s cost per unit is higher than that of A. So at this low price (50 paise per kg) producer B is not willing to offer any carrots for sale in the market. However, as price rises to Rs. 1.50 per kg, producer A offers 600 kg and producer B 150 kg Market supply is therefore 750 (=600 + 150) kg. At each price the market supply is the sum of the quantities offered by A and B as Table 8.2 indicates.
The market supply curve, shown in Fig. 8.2 (iii), is arrived at by adding up the supply curves of the two producers. (It would, however, be obtained straightaway by plotting the information contained in columns (i) and (iv) in Table 8.2). Thus the market supply curve is horizontal addition of the individual supply curves. So, when the market price is Rs. 2 per kg the market supply is 1,200 kg which is sum of 900 kg and 300 kg of the two producers, respectively. If we repeat the same exercise for other prices we get a number of points (as in Fig. 8.1).
The locus of all such points is the market supply curve SA+B. If we assume that there are 100 producers of carrots and all are alike in all respects then each of them would offer the same quantity at all possible prices. In this case the market supply curve would be a 100-fold extension of the individual supply curve. Since the supply curve of a producer is derived from its MC curve, the market supply curve would be the sum of the MC curves of individual firms.
Like the supply curve of an individual firm the market supply curve also slopes upward from left to right.
To sum up, the supply of any commodity per given period of time at any given price depends on the costs incurred in producing it. As we have already seen, both individual firms and the industry as a whole will be influenced by changes in prices. In the industry if price increases, this will increase the level of profit.
ADVERTISEMENTS:
Consequently, new firms will enter the industry while existing firms will increase their own outputs. A firm will increase its output until price and marginal cost are equal again. On the other hand, if price falls we would expect firms to supply less of a commodity and even to see some firms leaving the industry.
At any given moment it may be that the costs of increasing output may rise once the point its passed at which the most efficient use of existing capital is being made. Beyond this point it will be increasingly difficult to produce more output in each farm or factory—any price will have to rise for the quantity supplied of a commodity to increase.
Once we understand this relationship between price and the quantity supplied our first law of supply becomes reasonably obvious. It states that more -will tend to be supplied at a higher price than at a lower price and this generalisation is demonstrated as an upward sloping supply curve.
Movement along the Supply Curves & Shifts of the Curves:
The supply curve of a commodity normally shows the relation between the quantity supplied of a commodity and its market price assuming that all other factors influencing supply remain constant. On the basis of this assumption we consider movement along the same supply curve from left to right (or from right to left). But in practice we observe that other factors do not remain constant over time.
If there is a change in another variable the whole supply curve will shift to a new position. So economists find it necessary to draw a distinction between a movement along the supply curve and a shift to the entire curve. A movement along the same curve implies that a larger (smaller) quantity of a commodity is being supplied at a lower (higher) price. Such movements imply that different quantities are being offered for sale at different prices, ceteris paribus.
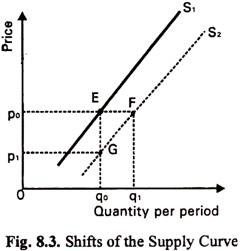
A shift of the curve implies that a different quantity is being offered for sale at each price, as Fig. 8.3 shows. As the supply curve shifts from S1 to S2 the quantity offered for sale at price p0 goes up from q0 to q1. Such shifts occur due to changes in one or more of the ceteris paribus assumptions and are known as changes in the conditions of supply.
Such changes may be of two types:
(a) an increase in supply and
(b) a decrease in supply.
ADVERTISEMENTS:
The former implies either of the following:
(i) a larger quantity at the same price (q1 at p0), or
(ii) the same quantity at a lower price (q0 at p1), as shown in Fig. 8.3 (compare points F and G).
ADVERTISEMENTS:
Little further needs to be said in our explanation of movements along the supply curve. When we say that the supply of a commodity depends on its market price we assume that ‘other things are equal’. The ‘other things’ here are the prices of other goods, the prices of the factors of production and the techniques of production. If, for example, the prices of other goods such as onions or cauliflowers rise the production of carrots will be less attractive than before. Producers will consider producing more of the other commodities and less of carrots. The result will be a decrease in the supply of carrots.
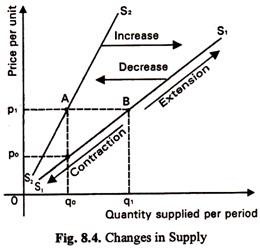
Similarly, a fall in the price of other goods is likely to cause an increase in the supply of carrots as production becomes more attractive. When one talks about an increase or a decrease we mean that there has been a change in the actual conditions of supply, such as the changes which result from the changing prices of other goods. This is illustrated in Fig. 8.4 where a decrease in the supply of carrots is shown by a shift of the supply curve to the left from S1 to S2 while an increase is shown by a shift to the right from S2to S1.
Similarly, if the prices of the factors which are used to produce carrots rise, then the conditions of supply have changed and the supply curve will shift to the left; it has become more expensive to produce carrots and less will be supplied at a given price. If it becomes cheaper to produce carrots because the factors become less expensive, the supply curve shifts to the right.
ADVERTISEMENTS:
The same is true if new methods of production are adopted. If these take the form of improved techniques then production may be cheaper and the supply curve will shift from S2 to S1. On the other hand, if for some reason, old and cheaper methods have to be abandoned for new and more expensive ones, as happens when more coal is extracted, for example, then the supply curve may shift to the left as less is supplied for a given price.
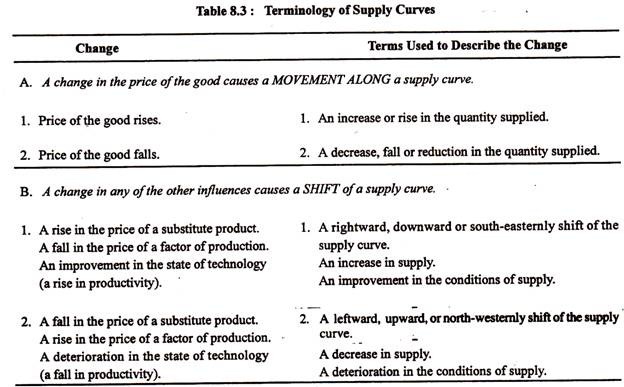
It is interesting at this stage to provide a few illustrations of the causes of shifts of supply curves as also to explain the directions of shifts. Table 8.3 summarises the main causes of such shifts and indicates their direction.
The supply curve of carrots could shift to the right from S1 to S2 in Fig. 8.3 due to any of the following causes:
(a) a fall in the price of any input such as a fall in the wage rate of agricultural workers,
(b) a change in technology such as the introduction of a new variety of fertiliser which raises yield per acre,
ADVERTISEMENTS:
(c) a fall in the market price of an alternative product such as cauliflower or beet, or
(d) a government subsidy on carrot production.
On the other hand, any of the following changes in the conditions of supply could explain shift of the supply curve to the left (from S2 to in Fig. 8.3):
(a) a rise in agricultural wages;
(b) a fall in productivity of workers engaged in carrot production;
(c) a rise in the price of cauliflower;
ADVERTISEMENTS:
(d) destruction of a portion of the crop due to untimely rain; or
(e) government quota restricting the production of carrots.
Time and Supply:
The response of suppliers to change in the price of a good also depends on the time period under consideration. It is generally observed that the longer the time that passes, and the longer a change is expected to last, the greater the likely response of producers to price changes.
However, the time pattern of response of producers varies from commodity to commodity. If factors can be easily transferred from the production of one commodity to that of another, producers will quickly respond to a change in price.
For example, a producer of carrots can use his land to grow other crops (though there is a time-lag between sowing and harvesting). On the other hand, an example of difficult switching of factors is an aircraft manufacturer. He would have so much specialist equipment that it would take a long time for him to switch his resources to other types of production (such as the manufacture of motor cars).
Three Conventional Time Periods:
The responsiveness of quantity supplied to a change in prices increases with the passage of time. This point was noted by Alfred Marshall who drew a distinction among three conventional time periods, viz., the momentary periods, the short-run and the long-run.
ADVERTISEMENTS:
In the momentary period or the very short run there is hardly any time to alter production; in the market for vegetables the time period may be just 24 hours. It is not possible to increase the supply of vegetables at 11 a.m. If one requires more vegetables one has to wait for the next morning.
In agriculture, on the other hand, the momentary period may refer to 3 to 6 months and in case of certain crops it may be even one year. A farmer may require a year to alter his output (of say, sugarcane) as a new crop is planted, grown, harvested and brought to the market (in larger or smaller quantities).
In the short run, production can be varied but the production capacity remains fixed. So it is not possible to produce beyond capacity. For example, a farm will have a fixed amount of demand and a manufacturer fixed plant and equipment. It is possible to produce more or less of a commodity by changing the usage of the variable factors such as labour and raw materials. But output cannot be increased beyond a certain limit due to fixed production facilities such as plant, equipment and machinery.
The long run refers to a time period during which it is possible to change the usage of all factors in response to price changes. All factors are variable in the long run including the size of the plant or factory. Moreover the long run permits factor substitution. Capital can be substituted by labour and labour by capital, keeping output changed or fixed.
So the producer enjoys a greater degree of flexibility in the long run than in the short run. The producer can set up new factories. Land can be diverted from other uses. More or less labour and raw materials may be used.
We will illustrate the nature and shape of three different types of supply curves in this context of elasticity of supply.
Exceptional Supply Curves (or Exceptions to the Law of Supply):
In the short run we normally come across upward sloping supply curves based on rising MC curves. But other shapes are also possible and are observed. In the long run, however, costs may and do not always rise with an increase in the volume of production.
ADVERTISEMENTS:
In fact, costs may remain constant or even fall when producers are able to make full adjustments to their outputs in response to changes such as a rise in demand. In-such cases, the long-run supply curve may be a horizontal straight line (with zero slopes) or a downward sloping curve (with negative slope).
The important exceptions to the law of supply are:
1. Supply curve of rare goods:
The supply curve of a rare good, such as the art work of a dead painter, is a vertical straight line. An unchanged quantity is offered for sale at all possible prices.
2. Supply curve of land:
The supply curve of land is also a vertical straight line. It is because the land area of a country is fixed.
3. Labour:
The supply curve of labour is backward bending. It is due to leisure preference. As wages rise, workers succeed in earning the same amount of money by putting less effort. So they prefer to work less. Moreover, when wages rise there is withdrawal of women, children and elderly people from the labour force. They are not required to work in order to supplement family incomes. As a result of these the supply curve of labour will bend back to the left. (This is also known as regressive supply curve).
