Generally theories of costs can be divided into two parts:
Traditional Theory of Costs/Short Run Cost Curves:
In traditional theory, costs are generalized in two parts on the basis of time period i.e. costs in short run and costs in long run period.
Costs are mainly of the following types:
ADVERTISEMENTS:
1. Total cost
2. Average cost
3. Marginal cost.
I. Total Cost:
According to Dooley, “Total cost of production is the sum of all expenditure incurred in producing a given volume of output.” In other words, the amount of money spent on the production of different levels of a good is called total cost. For instance, if a total sum of Rs. 2500 is spent on the production of 100 bicycles, then the total cost of producing 100 bicycles will be Rs. 2500. Since, there are two types of factors of production in the short run, so there are two types of costs.
Fixed Costs or Supplementary Costs:
The cost that remains fixed at any level of output is known as the fixed cost. These costs must be paid whether there is production or not. These costs include, depreciation allowance, interest on fixed capital, license fee, salaries to permanent staff etc.
In the words of Anatol Murad, “Fixed costs are costs which do not change with change in the quantity of output.” These costs are also known as the overhead costs or indirect costs because a firm has to incur these costs even if it shuts down temporarily. Thus, fixed costs are unavoidable which occur even at the zero level of output.
ADVERTISEMENTS:
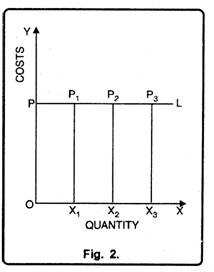
Fixed cost can be shown with the help of a table 1 and diagram 2:
In Figure 2 quantity has been measured on horizontal axis while costs on vertical axis. As is clear from the fig. 2 that even at zero level of output a firm has to incur fixed costs equal to OP. In the figure, output increases from OX1 to OX2 to OX3 but the fixed costs remain the same.
Variable Costs or Prime Costs:
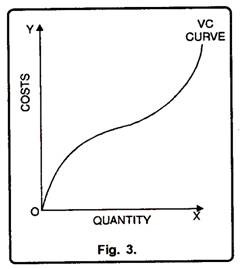
Variable costs refer to those costs which change with the change in the volume of output. These costs are unavoidable or contractual costs. Marshall called these costs as “Prime Costs”, “Direct Costs” or “Special Costs”. Variable costs include expenditure on transport, wages of labour, electricity charges, price of raw material etc. Thus, according to Dooley, “Variable costs are one which varies as the level of output varies.” It can be explained with the help of a table 2 and figure 3.
In Figure 3 variable cost curve starts from zero. It means when output is zero, variable costs are also zero. But as the output increases variable costs also increase. As is evident from the fig that when output is 1 unit variable costs are Rs. 20. But, as the output increases to 3 units, variable costs also increase to the tune of Rs. 2.
ADVERTISEMENTS:
Relation between Total, Fixed and Variable Costs:
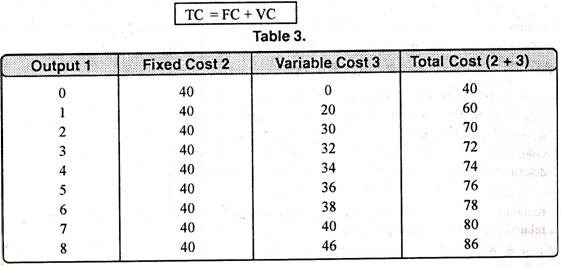
In order to determine the total costs of a firm, we aggregate fixed as well as variable costs at different levels of output i.e.
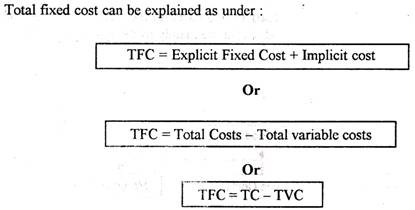
TC = TFC + TVC
TFC = TC – TVC
ADVERTISEMENTS:
TVC = TC – TFC
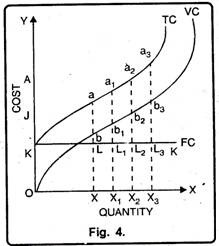
In table 3, when output is zero, variable costs are also zero. But the fixed costs as well as total costs are 40. As the output increases to 8 units, total costs go up to 86. It means as the output increases fixed costs remain the same, but variable costs increase at a diminishing rate then at constant rate and ultimately at an increasing rate. The relationship has been shown in diagram 4.
ADVERTISEMENTS:
In Figure 4 quantity is measured on horizontal axis while costs on vertical axis. KK is fixed cost curve which is parallel to horizontal axis which signifies the fact that at all levels of output, fixed costs remain the same. VC is the variable cost curve.
It is of the shape of reverse S. It means as the output is zero variable costs are also zero. But as the output increases, variable costs also start increasing, initially at diminishing rate, constant rate and then at an increasing rate.
Importance of Distinction between Fixed and Variable Costs:
This distinction is important in price theory. Every firm has the object to maximize profits or minimize losses, if losses are unavoidable. At times the price of the product may not cover average total cost. Then the firm will have to decide whether to shut down or produce some output.
1. Decision to Shut Down the Firm:
The producer may not cover the total costs, if the price of the product is less than the short-run average cost. Then the distinction between fixed cost and variable costs must be kept in mind. Fixed costs are incurred even at zero output. They are unavoidable costs. Variable costs are incurred only when some output is produced.
If the price does not cover average variable costs, the firm prefers to shut down. In other words if the total revenue (total sale proceeds) does not cover total variable costs, the firm must shut down. Otherwise, its total loss will be greater than the fixed costs. It will produce something only when the price covers average variable cost and part of the average fixed costs. The output at which marginal cost is equal to marginal revenue keeps losses minimum.
ADVERTISEMENTS:
2. Break-Even Point:
At times the firm may not make any profit. It just pays to produce a given output. Total revenue is just equal to total cost. The firm has crossed the losses zone and is about to enter the zero profit zone. The output at which total revenue becomes equal to total cost represents break-even point.
II. Average Cost:
According to Dooley, “The average cost of production is the total cost per unit of output.” In other words average cost of production is the total cost of production divided by the total number of units produced.
Suppose, the total cost of producing 500 units is Rs. 1000, the average cost will be:
Average Fixed Cost:
ADVERTISEMENTS:
Average fixed cost is the total fixed cost divided by the number of units of output produced.
Thus:
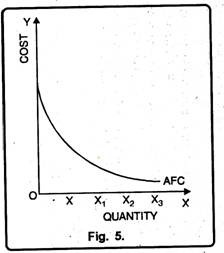
Since, total fixed cost is a constant quantity, average fixed cost will steadily fall as output increases, thus, the average fixed cost curve slopes downward throughout the length. It can be shown with the help of a figure 5.
In Figure 5 the average fixed cost curve slopes downward with a view to touch the horizontal axis. But it will not be so because AFC can never be zero. Thus, it is clear that as output increases, average fixed costs go on diminishing.
Average Variable Costs:
Average variable cost is the total variable cost divided by the number of units of output produced.
AVC = TVC / Q
AVC = Average variable costs.
TVC = Total variable costs Q = Output
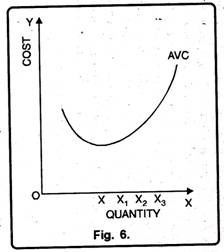
Generally, the AVC falls as output increases from zero to the normal capacity output due to the law of increasing returns. But beyond the normal capacity output, the AVC will rise steeply because of the operation of the law of diminishing returns as has been shown in figure 6.
In Figure 6 the average variable cost curve assumes the U- shape. Initially, the AVC curve falls, after having the minimum point the curve starts rising.
ADVERTISEMENTS:
Relation between Average Cost, Average Fixed Cost and Average Variable Cost:
Average cost is the lateral summation of average fixed and average variable cost.
The following table & fig. expresses their relationship:
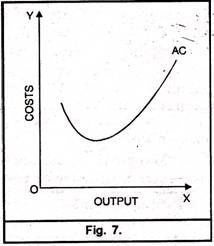
Average cost can be calculated by dividing total cost with units of output (q). In the above table AFC diminishes with the increase in production whereas AVC diminishes up to third unit. Total average cost is minimum at fourth unit after that it starts increasing because AVC is also increasing. Fig. 7 shows that average cost curve is of U-shape.
Why the short-run AC is curve U-shaped?
In the short-run average cost curves are of U-shape. It means, initially it falls and after reaching the minimum point it starts rising upwards. It can be on account of the following reasons.
1. Basis of Average Fixed Cost and Average Variable Cost:
It is well known, that average cost is the aggregate of average fixed cost and average variable cost (AC = AFC + AVC). To begin with, as production increases, initially the average fixed cost and average variable cost falls. But after a minimum point, average variable cost stops falling but not the average cost. It is due to this reason that average variable cost reaches the minimum before AC.
The point, where AC is minimum is called the optimum point. After this point, AC begins to rise upward. The net result is the increase in AC. Therefore, it is only due to the nature of AFC and AVC that AC first falls, reaches minimum and afterwards starts rising upward and hence assume the U-shape.
2. Basis of the Law of Variable Proportion:
The law of variable proportion also results in U-shape of short run average cost curve. If in the short period variable factors are combined with a fixed factor, output increases in accordance with the law of variable proportions. In other words, the law of ‘Increasing Returns’ applies.
Similarly, if we employ more and more variable factors with fixed factors the law of Diminishing Returns is said to apply. Thus, it is due to the law of variable proportions that the average cost curve assumes the shape of U.
3. Indivisibilities of the Factors:
Another reason due to which the average cost curve forms U-shape is the indivisibilities of factors. When in the short-run a firm increases its production due to indivisibilities of fixed factors, it gets various internal economies. It is these economies which cause the average cost curve to fall in the initial stage. Generally, there are three types of internal economies which help to bring down the cost viz., technical economies, marketing economies and managerial economies.
III. Marginal Cost:
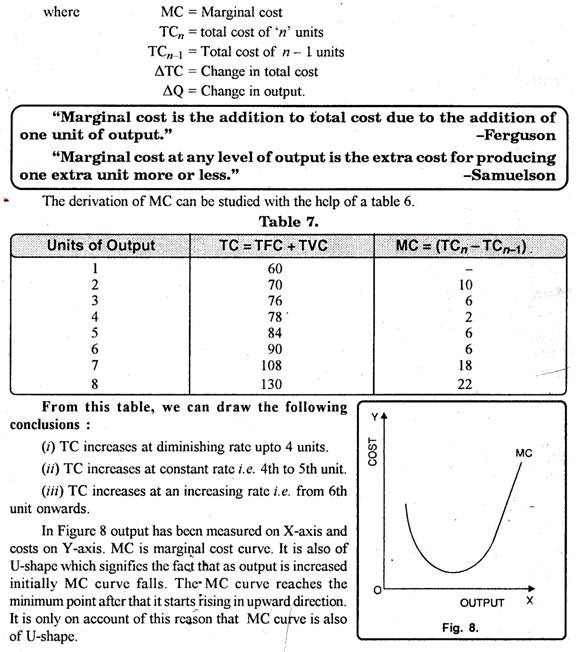
The concept of marginal cost of production is recently developed by Austrian School of Economics. Marginal cost is an addition to the total cost caused by producing one more unit of output. For instance, the total cost for the production of 100 units is Rs. 5000. Suppose the production of one more unit costs Rs. 5000. It will be called the marginal cost.
Why is the MC Curve of U-shape?
Marginal cost means the addition made to total cost on account of producing one more unit of output. In the beginning, when a firm increases its output, total costs as well as variable costs start increasing at a diminishing rate.
It is only due to the reason that in the initial stage of production law of increasing returns applies. Moreover, in the initial stage of production, the firm enjoys many economies which cause the MC to fall. As the output continues, marginal cost becomes minimum, thus, ultimately starts rising.
The reason being the operation of the Law of Diminishing Returns. In short, initially marginal cost falls and after having the minimum point it begins to rise. Thus, it is how the MC is also of U-shape.
Relation between Average and Marginal Cost:
The relation between average and marginal cost can be explained with the help of following table:
Main points of the relation are as under:
(1) Average Cost and Marginal Cost can be calculated from Total Cost:
Average cost and marginal cost can be calculated from total cost. As is known, average cost is the ratio of total cost to total output. In other words, AC is calculated by dividing the total cost by the quantity of output. It means.
AC = TC / Q
In the same way, marginal cost can also be calculated from total cost. It refers to an addition made to total output by producing one more unit of output. Thus,
MC = TCn – TC n-1
MC = ∆TC / ∆Q
When average cost falls, MC also falls:
In this situation, rate of fall in marginal cost is more than fall in average cost. In other words, when AC curve is falling, MC curve will be below it. The reason behind this is that whereas average cost is the aggregate of average fixed cost and average variable cost, marginal cost refers only to change in average variable cost.
(3) When AC rises, MC also rises:
When average cost curve rises, marginal cost too rises, but rate of increase in marginal cost is more than that of average cost.
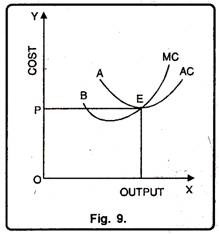
(4) MC cuts AC at its Lowest Point:
Marginal cost is equal to average cost when the latter is at its minimum. The minimum point of marginal cost occurs earlier than the average cost.
(5) When AC is constant MC becomes equal to AC:
When AC is constant, marginal cost first increases and then becomes equal to it. Figure 9 shows the picture more vividly.
(6) Use of MC and AC in Price Determination:
The concept of marginal cost is of great significance in finding out equilibrium output and that of average cost in finding out profit and loss. Equilibrium output is one at which marginal cost is equal to marginal revenue.
A firm earns normal profit when its average cost is equal to average revenue. It earns supernormal profit when average revenue is more than average cost. Moreover, a firm earns losses when average cost is more than average revenue.
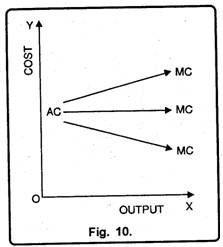
(7) Mutual Interaction between MC and AC:
In Fig. 10 when marginal cost is more than average cost, average cost has a tendency to rise. It seems as if marginal cost curve is pulling the AC curve upward. On the other hand, when MC is less than AC, it pulls the AC ‘ curve downward. When MC is equal to AC then the latter is constant.


