Demand and total revenue:
From the market-demand curve we can derive the total expenditure of the consumers, which forms the total revenue of the firms selling the particular commodity.
The total revenue is the product of the quantity sold and the price
TR = P . Q
ADVERTISEMENTS:
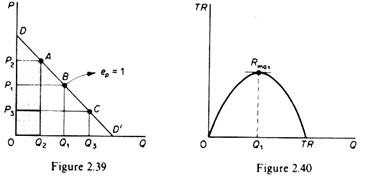
If the market demand is linear the total-revenue curve will be a curve which initially slopes upwards, reaches a maximum point and then starts declining (figure 2.40).
At any one price the total revenue is the area of the rectangle defined by drawing perpendiculars from that price and the corresponding quantity to the demand curve. For example, in figure 2.39, the total revenue at price P2 is the area of the rectangle P2AQ20.
Of particular interest to the theory of the firm is the concept of marginal revenue. The marginal revenue is the change in total revenue resulting from selling an additional unit of the commodity.
ADVERTISEMENTS:
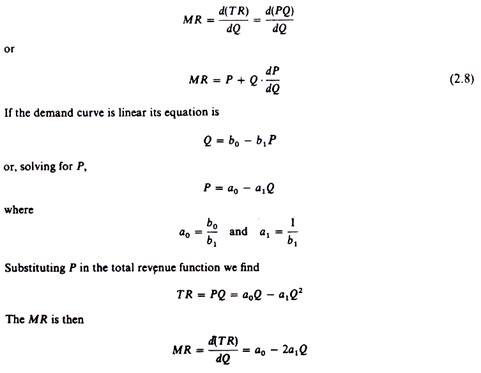
Graphically the marginal revenue is the slope of the total-revenue curve at any one level of output. If the demand curve is linear, it is obvious that in order to sell an additional unit of x its price must fall. Since the whole quantity will be sold at the new lower price, the marginal revenue will be equal to the price of the extra unit sold minus the loss from selling all previous units at the new lower price
MR = Pn+1 – (Pn – Pn+1) Qn
Where Qn is the quantity sold before the fall in price. Clearly at all prices the MR is smaller than the price, given that (Pn – Pn+1) (= ΔP) is positive and Qn is positive.
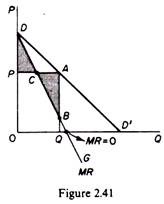
Graphically the marginal revenue can be derived from the demand curve as follows. Choose any point of the demand curve (such as point a) and draw perpendiculars from it on the price and the quantity axes (AP and AQ respectively). Next find the mid-point of the perpendicular PA.
ADVERTISEMENTS:
In figure 2.41 the mid-point of PA is C. Draw a straight line from D through C and extend it until it cuts the perpendicular AQ (at point B in figure 2.41). This line is the marginal-revenue curve. To see that, we first note that the total revenue at price P (= OPAQ) is the sum of the marginal revenues of all individual units (= ODBQ) The two areas, OPAQ, and ODBQ, are in fact equal because they have in common the area OPCBQ, and the triangles DPC and CAB are equal (they have the corresponding angles equal and one side equal by construction PC = CA).
Hence the MR curve is the line DCBG, and may be derived by joining the midpoints of perpendiculars drawn from the demand curve to the price-axis. In other words, the MR curve cuts any such perpendicular at its midpoint (provided that the demand is a straight line).
This proves that the MR curve starts from the same point (a0) as the demand curve, and that the MR is a straight line with a negative slope twice as steep as the slope of the demand curve. This is the same result that we established above using simple geometry.
The relationship between marginal revenue and price elasticity:
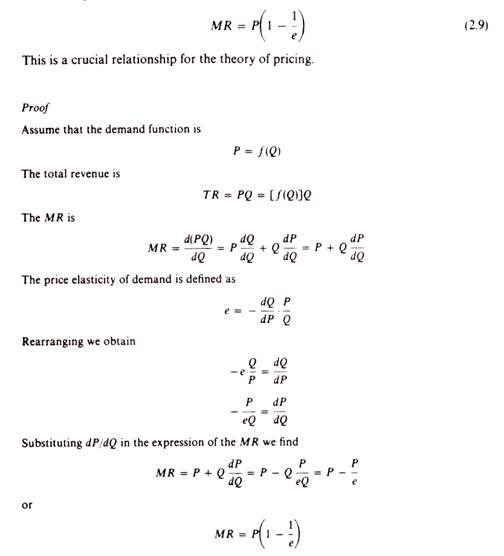
The marginal revenue is related to the price elasticity of demand with the formula
Total revenue, marginal revenue and price elasticity:
ADVERTISEMENTS:
We said that if the demand curve is falling the TR curve initially increases, reaches a maximum, and then starts declining. We can use the earlier derived relationship between MR, P and e to establish the shape of the total-revenue curve.
The total-revenue curve reaches its maximum level at the point where e = 1, because at this point its slope, the marginal revenue, is equal to zero
MR = P (1 – 1/1) = 0
If e > 1 the total-revenue curve has a positive slope, that is, it is still increasing, and hence has not reached its maximum point given that
ADVERTISEMENTS:
P > 0 and (1 – 1/e) > 0; hence MR > 0
If e, 1 the total-revenue curve has a negative slope, that is, it is falling, given
P > 0 and (1 – 1/e) < 0; hence MR > 0
We may summarise these results as follows:
ADVERTISEMENTS:
If the demand is inelastic (e < 1), an increase in price leads to an increase in total revenue, and a decrease in price leads to a fall in total revenue.
If the demand is elastic (e > 1), an increase in price will result in a decrease of the total revenue, while a decrease in price will result in an increase in the total revenue.
If the demand has unitary elasticity, total revenue is not affected by changes in price, since if e — 1, then MR = 0.


