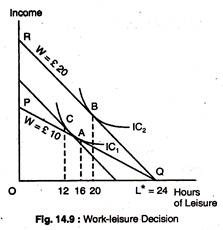
The upcoming discussion will guide you about the relationship between income and leisure.
Indifference curve can show the relationship between leisure and income.
The horizontal axis represents hours of leisure and the vertical axis represents income.
The origin indicates that the individual B has no leisure. If B does not work, he has the maximum amount of leisure time available. The maximum amount of leisure is L*, as in Fig. 14.9.
We can assume that leisure is enjoyable, but that work benefits the worker only through the income that is earned. We also assume that a worker can choose how many hours per day to work. The wage-rate measures the price that the worker places on leisure time because the wage is the amount of money that one gives up to enjoy leisure.
As the wage-rate increases, the price of leisure also increases. As we already know, a price change brings about a substitution effect and an income effect. Here, these two effects occur when wage rate is increased. There is a substitution effect because the higher price of leisure encourages workers to substitute work for leisure.
An income effect occurs because the higher wage rate increases the worker’s real income. With this higher income, the worker can buy more goods, including leisure. If more leisure is purchased, then the income effect encourages the labour to work fewer hours.
In addition, if income effect is large enough, the worker will work less as the wage rate increases. Income effects can be very large because wages are the primary determinants of most people’s income. When a higher wage leads to a fewer hours because of the large income effect, the result is the backward-bending supply curve.
ADVERTISEMENTS:
Fig. 14.9 shows the work-leisure decision that leads to the backward-bending supply curve of labour. The horizontal axis represents hours of leisure per day, the vertical axis represents income generated by work. Initially, the wage rate is £10 per hour, and the budget line is PQ. Point P shows that the individual who works for 24-hours earns an income of £240.
The worker maximises utility by choosing point A and by enjoying 16 hours of leisure per day (with 8 hours of work) and earning £80. When the wage rate increases to £20 per hour, the budget line rotates about the horizontal intercept to line RQ.
Now, the worker maximises utility at B by choosing 20 hours of leisure per day and earning £80, in the process. Were only the substitution effect to arise, the higher wage-rate would encourage the worker to work 12 hours (at point C), instead of 8. However, the income effect works in the opposite direction and it overcomes the substitution effect and lowers the work-day from 8 to 4 hours.
