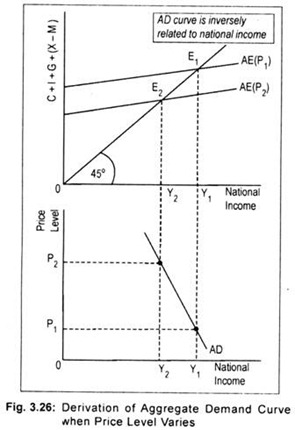
A change in price level brings about a change in aggregate demand or expenditure. Here the aggregate demand curve shows the level of national output that will be demanded at each price level.
Normally, demand for output is inversely related to the price level. This means that when the price level rises, households reduce their consumption spending.
Businessmen reduce their investment expenditures because higher price level pushes interest rates up.
Likewise, net exports will fall if the price level rises. A higher price level means expensive exports. Foreigners will buy our products less when the price level rises. On the other hand, imports become cheaper when the price level rises. Thus, in the midst of an increase in the price level, export earnings will fall while import bill will tend to increase. This results in a decline in net exports. All these will cause aggregate demand to shift downwards.
ADVERTISEMENTS:
In the upper panel of Fig. 3.26, aggregate expenditure line at the initial price level, denoted by AE (P1), cuts the 45° line at point E1. Equilibrium national income, thus, determined is OY1. Corresponding to price OP1, OY1 is a point on the aggregate demand schedule in the lower panel of the figure. Now, suppose price level rises to P2. This causes aggregate expenditure to decline to AE (P2).
As a result, national output declines to OY2. Now we obtain OY2 income on the aggregate demand schedule at a higher price level OP2. By joining these (P – Y) combinations, we get negative sloping aggregate demand curve. While deriving aggregate demand curve, we assume price level constant. Here as price level is assumed to vary, aggregate demand for national output rises (falls) when price level declines (falls).
Changes in aggregate demand/expenditure, such as increases in private investment expenditure, government expenditure exports, etc., cause aggregate demand curve to shift to the right while decreases in these expenditures cause leftward shift of the aggregate demand curve.
